Best HR Analytics Software in 2026: 8 People Analytics Tools I'd Actually Recommend
Most HR teams already sit on a mountain of data. It's in the HRIS, the payroll system, the ATS, the engagement survey tool, and about nine spreadsheets nobody fully trusts. The problem was never collecting the numbers. The problem is turning them into something a CFO will believe and a manager will act on.
That gap is what HR analytics software is supposed to close. The good platforms pull headcount, turnover, compensation, and engagement data into one place, then let you ask real questions: why is attrition spiking in the sales org, what does a hiring freeze actually cost, which managers are quietly burning people out. The weak ones just give you a prettier version of the dashboard you already ignore.
I've spent time inside most of the tools below and dug into current pricing. Short answer: Visier is still the strongest dedicated people analytics platform for larger companies, and Crunchr is the one I'd point most mid-market teams to first. But the right pick depends on your headcount, your stack, and whether you have a data person to feed the thing. Here's the full breakdown.
Quick comparison
| Tool | Best for | Price | Standout |
|---|---|---|---|
| Visier | Enterprises (1,000+ employees) | Custom, often $50k+/yr | Pre-built workforce models and benchmarks |
| Crunchr | Mid-market and global EU teams | Per-employee, custom quote | 2-week setup, GDPR-first design |
| ChartHop | Org design and headcount planning | ~$8-20 per employee/mo | Interactive org charts tied to comp data |
| Worklytics | Hybrid work and AI-adoption insights | Custom quote | Privacy-first work-pattern analytics |
| Workday People Analytics | Existing Workday HCM customers | Add-on to Workday | Native, no data migration |
| Deel HR Analytics | Distributed and global workforces | Bundled with Deel HR | Multi-country cost and headcount views |
| BambooHR | Small and mid-size teams | ~$10-25 per employee/mo | Reporting baked into a simple HRIS |
| Culture Amp | Engagement-led people analytics | Custom quote | Survey science plus workforce data |
Visier (best overall for enterprises)
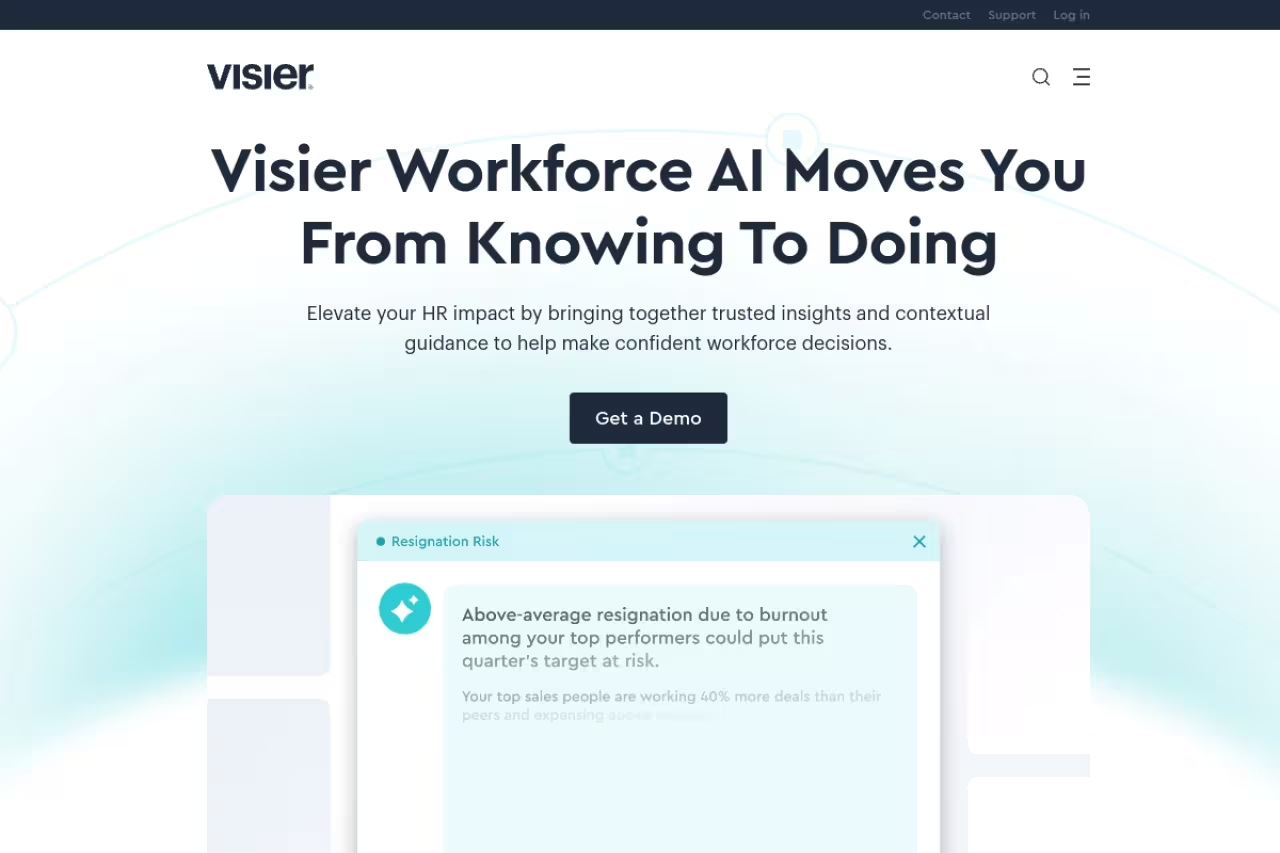
Visier is the platform most people picture when they hear "people analytics." It was built by business intelligence veterans, and it shows. Instead of handing you a blank canvas, it ships with pre-built workforce models for attrition, retention, span of control, diversity, and compensation, plus benchmarks you can compare yourself against. You connect your HR systems, and within those models you can ask plain questions and get answers that hold up in a board meeting.
It's best for companies past about 1,000 employees, especially global ones with messy data across regions. Visier's own homepage now leans hard into "Workforce AI," with scenario planning that lets you test hiring, restructuring, or skills changes and see the cost and staffing impact before you commit. That predictive layer is genuinely useful when you're planning a reorg rather than just reporting last quarter.
Pricing is custom and not published. Based on buyer reports and analyst notes, enterprise deals commonly start around $50,000 a year and climb with headcount and modules, usually on a 1-to-3-year contract. TrustRadius and Gartner Peer Insights both note Visier rarely offers month-to-month terms.
The catch: this is a heavy tool. Implementation runs 8 to 16 weeks, and to get full value you really want a data person to manage the feeds and a Visier specialist to drive it. For a 200-person company it's overkill, both in cost and complexity. Buy it when analytics is a real function, not a side project.
Crunchr (best for mid-market and European teams)
Crunchr is the tool I find myself recommending most often, because it hits the sweet spot Visier overshoots. Built in Amsterdam and used by companies like Randstad, Rabobank, and AkzoNobel, it gives you hundreds of out-of-the-box metrics across recruitment, retention, diversity, performance, mobility, and succession, without the multi-month onboarding.
It's best for mid-market and global mid-market HR teams who want enterprise-grade analytics but don't have a dedicated data science group. The interface is genuinely usable by regular HR business partners, not just analysts, and Crunchr has layered in generative AI so a manager can type a question in normal language and get a chart back. For European companies, the GDPR-first design and EU data residency are a real differentiator over US-first platforms.
Crunchr uses a per-employee-per-year headcount model, and the rate drops as your company grows. Pricing is quote-based rather than public, so you'll need a demo to get a number, but it consistently lands well below Visier for similar coverage. Setup is the headline: roughly two weeks to go live with working analytics, versus the quarter-long projects enterprise tools demand.
Where it falls short: it's a pure analytics layer, not an HRIS. You still need a system of record feeding it, and if you want one tool that also runs payroll and onboarding, this isn't it. It's also less of a fit for tiny teams where the per-employee math doesn't pay off yet.
ChartHop (best for org design and planning)
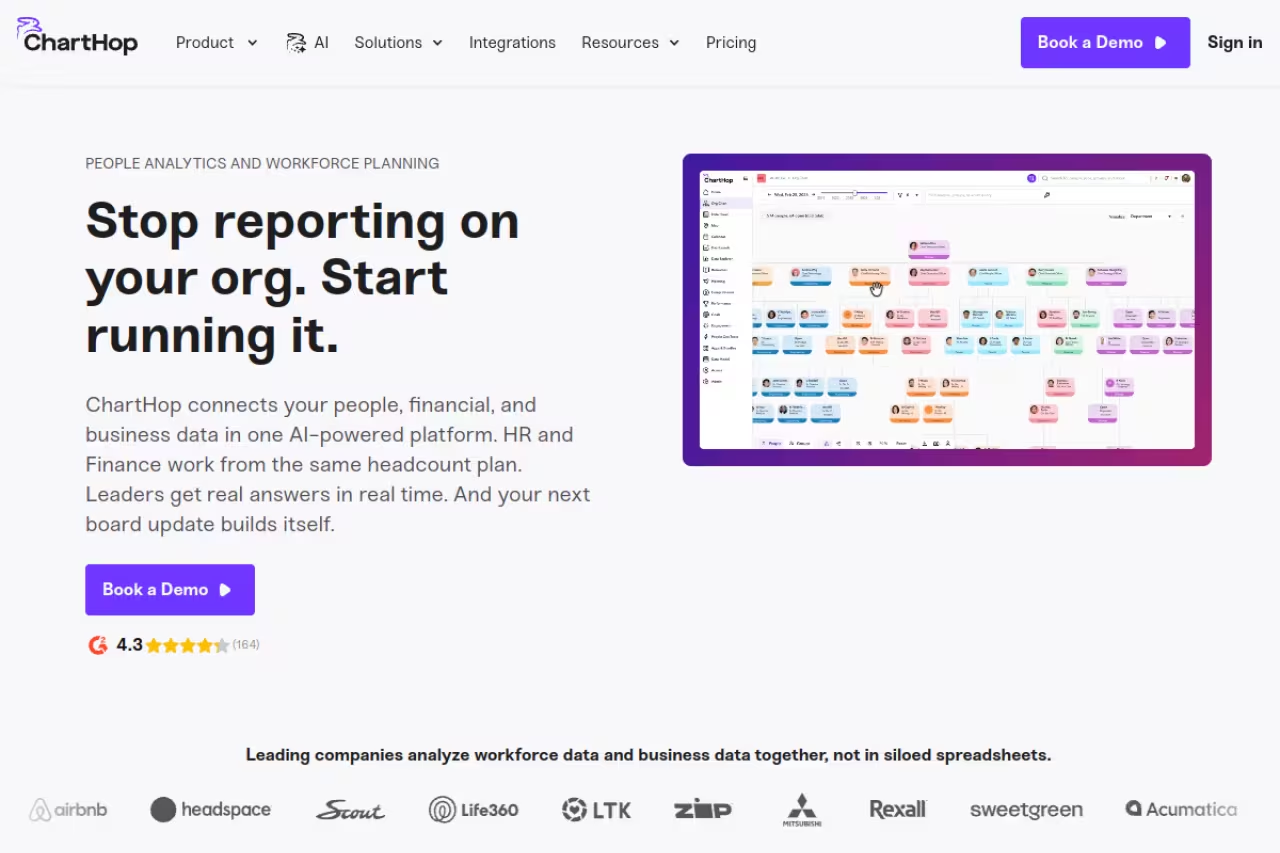
ChartHop comes at HR data from a different angle. Where Visier and Crunchr lead with metrics, ChartHop leads with the org chart. It turns your headcount, compensation, and structure into an interactive map you can actually plan against, dragging boxes around to model a reorg, then seeing the comp and headcount cost update live.
It's best for People Ops and finance teams doing active workforce planning: headcount budgeting, compensation reviews, and org design. The spreadsheet-style data sheet is a favorite for comp cycles, and tying salary bands directly to the visual org structure makes planning conversations a lot more grounded.
On pricing, ChartHop publishes more than most. Per vendor and Vendr marketplace data, the first core module runs about $8 per employee per month with each added module around $4, and there's a lighter Basic tier near $2 per employee per month. Core plans typically carry a minimum annual commitment in the $9,000 range, so it suits companies past roughly 50 to 100 people.
The catch: ChartHop is strong on planning and structure but lighter on predictive analytics and engagement depth than the dedicated platforms. If your main question is "why are people leaving," you'll get further with Crunchr or Visier. If it's "what does next year's org look like and what does it cost," ChartHop is hard to beat.
If you're assembling a wider stack of AI-driven tools to support these workflows, our roundup of the best AI tools for business pairs well with anything here.
Worklytics (best for work-pattern and AI-adoption insights)
Worklytics measures something the others mostly can't: how work actually happens. It pulls from collaboration tools to surface patterns in meetings, focus time, manager effectiveness, burnout risk, and, as of 2026, AI adoption across teams. Its March 2026 update added a dashboard comparing work behaviors between high and low AI-usage teams, which is genuinely interesting if you're trying to figure out whether your AI rollout is doing anything.
It's best for IT and People leaders managing hybrid and remote workforces who want evidence, not vibes, about how the org spends its time. Worklytics is deliberately privacy-first: no keystroke logging, no surveillance, data aggregated rather than tied to individuals. Pricing is custom and quote-based.
Where it falls short: this is collaboration and work-pattern analytics, not classic HR reporting. It won't replace your turnover and compensation dashboards. Treat it as a specialist add-on to a core platform, and be ready to handle the "is this employee monitoring" conversation with your team honestly, because the aggregation approach matters and people will ask.
Workday People Analytics (best if you already run Workday)
If your company already lives in Workday HCM, the path of least resistance is its native People Analytics layer. It sits on top of Workday's data model, so there's no migration or connector wrangling, and it ships pre-built dashboards plus AI-driven insights through Workday Illuminate. Prism Analytics lets you blend in external data when you need to look beyond HR.
It's best for existing Workday customers who want decent analytics without integrating a separate tool. The big win is data trust: it's already your system of record, so there's no argument about whose headcount number is right.
The catch: it's a paid add-on, and it's only as good as Workday's data and your configuration. Teams that have used both tend to find dedicated platforms like Visier more flexible for ad-hoc analysis and benchmarking. If you're not a Workday shop, none of this applies.
Deel HR Analytics (best for global and distributed teams)
Deel built its name on global payroll and contractor management, and its HR analytics reflects that DNA. The reporting gives real-time views of a distributed workforce across countries: payroll costs, turnover, headcount trends, all sliced by region, with reports you can shape for finance, IT, or leadership.
It's best for companies hiring across many countries who want their analytics in the same place they run global payroll and compliance. Deel's own 2026 Global Hiring Report flagged a 283% surge in AI roles and a broad shift toward skills-based hiring, which is the kind of macro signal their data is well positioned to track.
Where it falls short: analytics here is a feature of a broader global HR and payroll platform, not a standalone people analytics engine. The depth on predictive modeling and engagement is thinner than a Visier or Crunchr. If global workforce cost and headcount visibility is your main need, it's excellent. If you want deep behavioral or attrition modeling, you'll outgrow it.
BambooHR (best for small and mid-size teams)
BambooHR is the practical answer for smaller companies that don't need a dedicated analytics platform yet. It's a clean, well-liked HRIS with reporting and analytics built in, so you get turnover, headcount, time-off, and compensation reporting without standing up a second system.
It's best for teams under a few hundred people who want solid reporting as part of their core HR system. For most SMBs, this coverage is more than enough, and the simplicity is a feature.
On price, BambooHR doesn't publish list rates, but 2026 buyer data puts it around $10 per employee per month for Core, roughly $17 for Pro, and near $25 for Elite, with a flat rate around $250/month for teams of 25 or fewer. Note that advanced analytics and reporting sit in the higher tiers, per PeopleManagingPeople's pricing breakdown.
The catch: this is reporting, not deep people analytics. There's no real predictive modeling or external benchmarking, and once your questions get sophisticated you'll feel the ceiling. It's the right starting point, not the destination, for a fast-growing company.
Culture Amp (best for engagement-led analytics)
Culture Amp approaches people analytics through the lens of engagement and employee experience. Its survey science is the core, and it connects sentiment data to workforce data to explain the why behind your numbers. The 2024 acquisition of people-analytics startup Orgnostic strengthened its workforce analytics side, so it's no longer just a survey tool.
It's best for HR teams where engagement and culture are the central story, and you want attrition and performance insight grounded in how people feel, not just what they do.
Where it falls short: if your priority is hard workforce planning, compensation modeling, or org design, this is the wrong center of gravity. Culture Amp shines on engagement, manager effectiveness, and retention drivers, but it's more specialist than a general-purpose analytics platform.
How to choose
Skip the feature checklists and start with three questions.
How big are you? Under ~200 employees, BambooHR's built-in reporting or a lightweight tool covers you. From ~200 to a few thousand, Crunchr and ChartHop are the value picks. Past that, with global complexity, Visier earns its price.
What's your real question? "Why are people leaving and who's next" points to Visier or Crunchr. "What does next year's org cost" points to ChartHop. "How is our team actually working" points to Worklytics. "Is engagement driving attrition" points to Culture Amp. Buy for the question you ask most, not the one you ask once.
What do you already run? If you're on Workday, its native analytics is the cheap, low-friction default. If you run global payroll on Deel, its reporting may be enough. Don't add a platform to answer a question your existing stack already handles.
One honest warning: every one of these is only as good as the data you feed it. A great platform on top of three contradictory HR systems still gives you confident, wrong answers. Clean your data first.
If you're building out the broader AI-and-ops toolkit around these, the Dupple X bundle and our top tools directory are a fast way to see what teams like yours are standardizing on.
Start your Dupple X trial to get our full library of tool breakdowns and templates.
FAQ
What is HR analytics software?
HR analytics software, also called people analytics software, pulls data from your HRIS, payroll, ATS, and engagement tools into one place so you can measure and act on workforce trends. Instead of static reports, it lets you track turnover, hiring velocity, headcount cost, and engagement, and often model future scenarios like reorgs or hiring freezes.
How much does HR analytics software cost in 2026?
It ranges widely. Entry-level reporting baked into an HRIS like BambooHR runs roughly $10-25 per employee per month. Mid-market analytics platforms like Crunchr and ChartHop typically land around $8-25 per employee per month. Enterprise platforms like Visier use custom pricing that often starts near $50,000 a year and scales with headcount and modules.
What is the best HR analytics software for small businesses?
For most small and mid-size teams, BambooHR's built-in reporting is the practical choice because it bundles analytics with a simple HRIS at a reasonable per-employee cost. If you need more depth without enterprise pricing, ChartHop's lighter tier and Crunchr are the next step up as you grow past 50 to 100 people.
How is people analytics different from standard HR reporting?
Standard HR reporting tells you what happened: last quarter's turnover, current headcount, who's on leave. People analytics goes further by connecting data sources, benchmarking against peers, and using models to explain why something is happening and predict what's next, like which teams are at high attrition risk. Tools like Visier and Crunchr are built for that predictive layer; basic HRIS reporting usually isn't.
How long does it take to implement HR analytics software?
It depends on the tool. Enterprise platforms like Visier and Workday People Analytics commonly take 8 to 16 weeks for full implementation because of data integration and modeling work. Mid-market tools like Crunchr and ChartHop can go live in roughly two to four weeks, and built-in HRIS reporting is available almost immediately once your data is in the system.
