The Best Observability Platforms in 2026
Observability is the part of the stack everyone underbudgets. You pick a tool when you have ten services, then two years later you're runningmicroservices on Kubernetes and the monthly bill has quietly passed your cloud compute spend. I've watched teams discover their monitoring costs more than the thing it monitors.
The good news is thatis the best year yet to make this decision. OpenTelemetry won. It's now the default way to instrument applications, which means you can send the same traces, metrics, and logs to almost any backend without rewriting your code. The platforms now compete on storage architecture, query speed, correlation, and price instead of locking you in with proprietary agents. That gives you real use.
If you want the short version: Datadog is still the most complete platform and the safest default for teams that hate tool sprawl. Grafana Cloud wins if you have a strong DevOps team and want open-source control. And SigNoz is the one I'd point a cost-conscious startup toward, because it gives you traces, logs, and metrics in one place without per-host or per-seat pricing. Below are the seven I'd actually recommend, with honest trade-offs.
Quick comparison
| Tool | Best for | Price | Standout |
|---|---|---|---|
| Datadog | Teams wanting one platform for everything | $15/host/mo (Pro infra) | 1,000+ integrations, every signal in one place |
| Grafana Cloud | DevOps teams wanting open-source control | Free tier, then $19/mo + usage | Best dashboards, no vendor lock-in |
| SigNoz | Cost-conscious startups, OTel-native | Free self-host, cloud from $49/mo | One backend for traces/logs/metrics, no seat fees |
| New Relic | Predictable usage-based billing | 100 GB/mo free, then $0.40/GB | Unlimited hosts at no cost |
| Honeycomb | Debugging high-cardinality systems | 20M events/mo free, Pro $130/mo | Event-based pricing, fast wide queries |
| Sentry | Error tracking for app developers | Free tier, Team $26/mo | Best-in-class error grouping and traces |
| Dynatrace | Large enterprises with complex infra | ~$58/host/mo (8 GB) full-stack | Davis AI automated root cause |
Datadog: the default for most teams
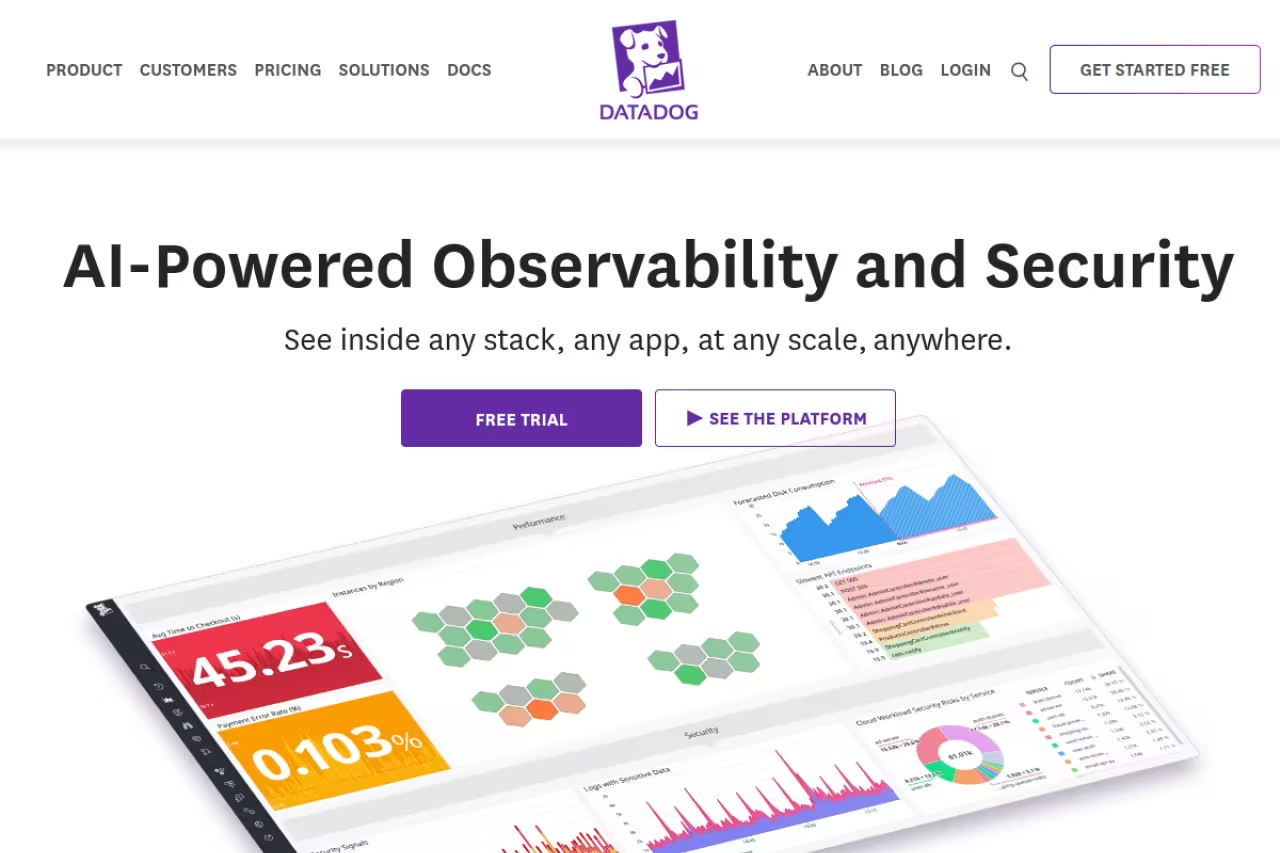
Datadog is what most teams end up on, and for a reason. It covers metrics, logs, traces, APM, real user monitoring, synthetics, database monitoring, network monitoring, and security in one product. When something breaks at 3am, you don't bounce between five tools to find the cause. It's all correlated in one place, with over 1,000 integrations so your cloud provider, message queue, and database are wired in within minutes.
Who it's for: mid-size to large teams that value time-to-resolution over saving money, and that are tired of stitching together separate tools.
Infrastructure monitoring is $15/host/month on the Pro plan billed annually ($18 on-demand), and $23/host/month for Enterprise. APM adds $31/host/month on top when bundled with infra. Log management is $0.10 per ingested GB plus $1.70 per million indexed log events. There's a free tier for up toDatadoghosts with 1-day retention. All numbers are on the official pricing page.
The standout: correlation. A single trace links to the host metrics, the logs, and the deploy that caused the regression, and Datadog's Watchdog surfaces anomalies you didn't write alerts for.
The catch: the bill. Datadog's multi-dimensional pricing (hosts plus data plus indexing plus custom metrics) makes costs genuinely hard to predict. In a large Kubernetes environment where pods spin up and down, I've seen monthly bills land atDatadogto
SigNoz: the OTel-native cost saver
times the entry-point estimate. Custom metrics in particular can balloon. Budget carefully and turn on usage attribution early.Grafana Cloud: open-source control without the ops burden
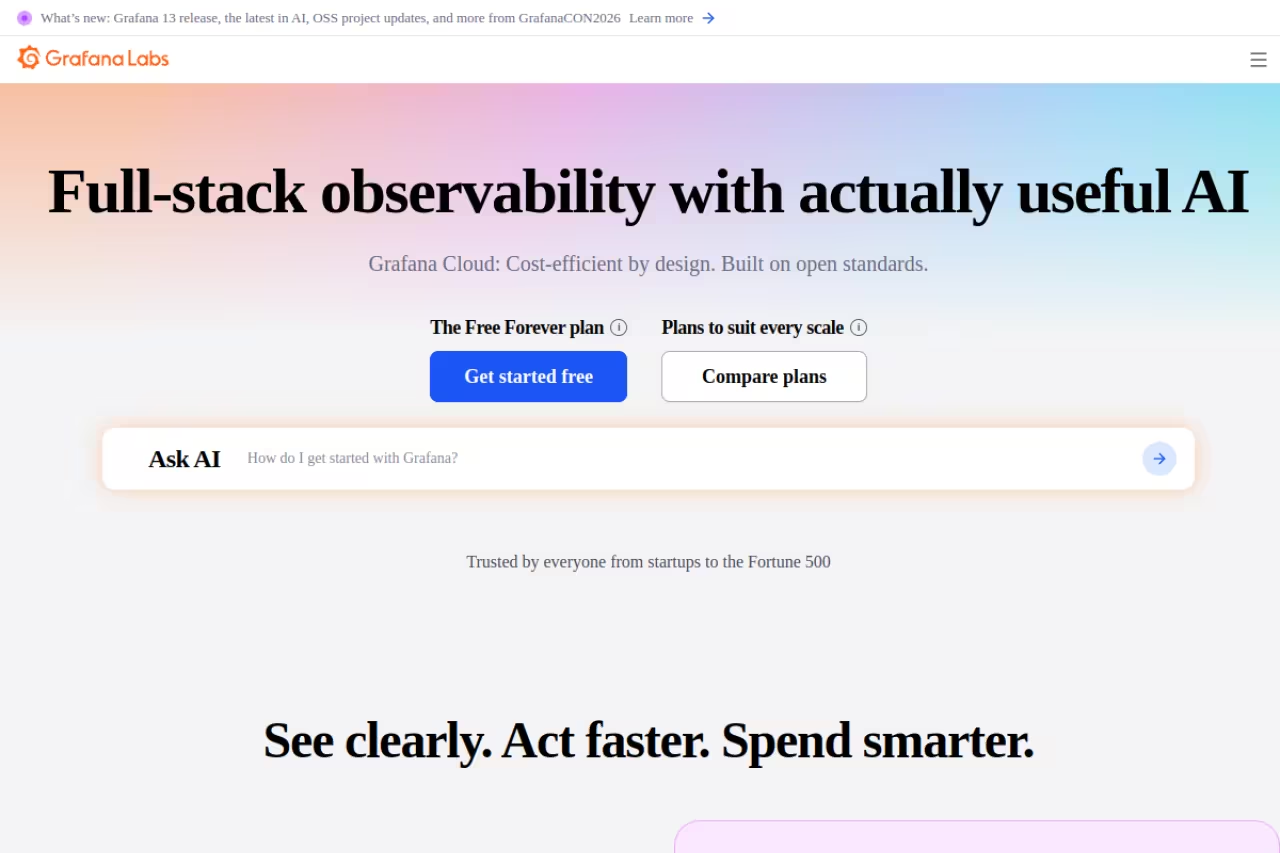
Grafana is the dashboard everyone already knows. Grafana Cloud wraps the open-source stack (Prometheus-compatible Mimir for metrics, Loki for logs, Tempo for traces, Pyroscope for profiles) into a managed service so you get the flexibility of running it yourself without babysitting the storage layer.
Who it's for: teams with DevOps muscle who want to own their observability stack and avoid vendor lock-in, but don't want to operate ClickHouse or Cassandra clusters in production.
the free tier is generous: 10k active metric series,GB of logs, andGB of traces per month, all with 14-day retention. The Pro plan is a $19/month platform fee plus usage: $6.50 per 1,000 metric series beyond the free amount, and roughly $0.40/GB to write logs plus smaller process and retain fees. Full breakdown on Grafana's pricing page.
The standout: the dashboards, still the best in the business, and the fact that nothing locks you in. Your data is in open formats and your queries are PromQL and LogQL, which transfer to a self-hosted setup if you ever leave.
The catch: metric series pricing punishes high cardinality. If your team labels everything with user IDs or request IDs, your active series count (and your bill) explodes. The components are also more loosely coupled than Datadog's, so correlation across logs, metrics, and traces takes more setup work to feel automatic.
SigNoz: the OTel-native cost saver
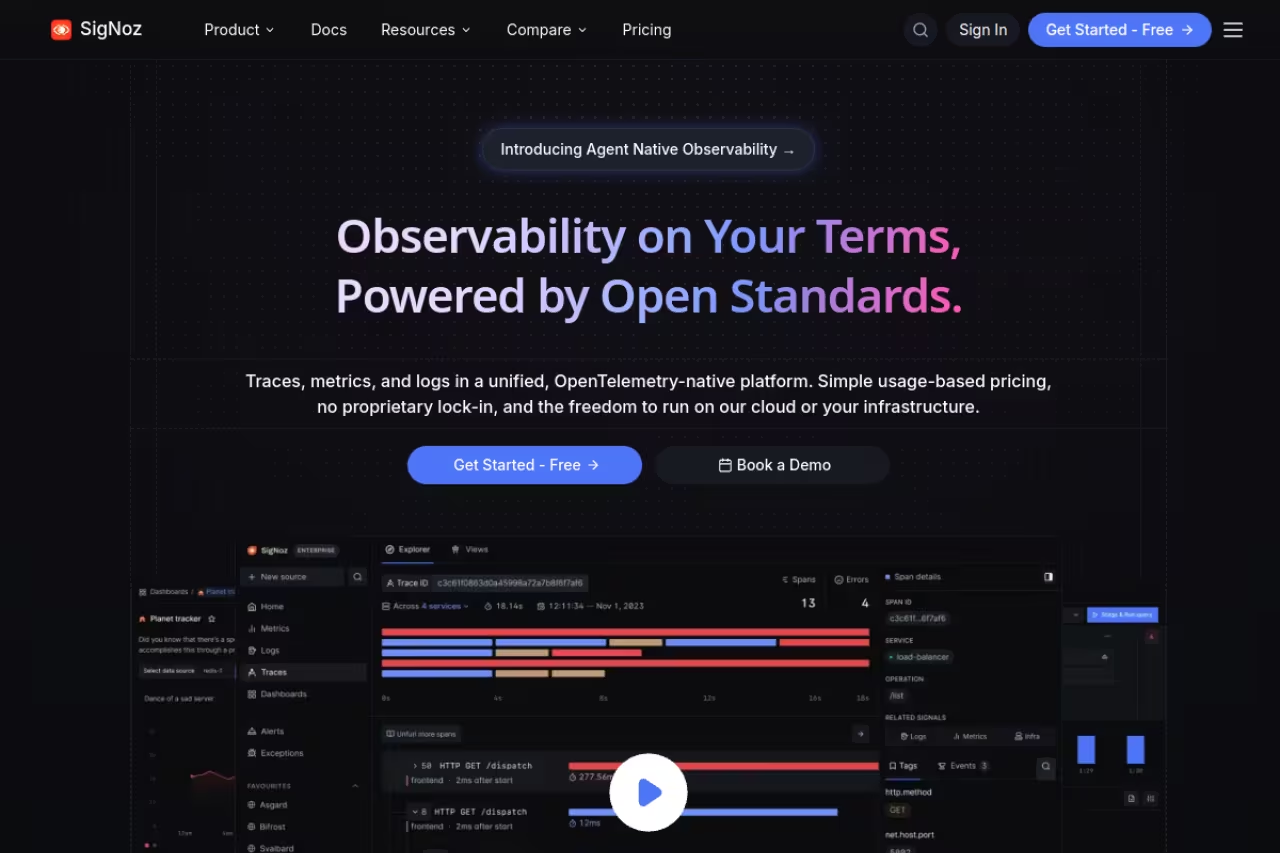
SigNoz is the open-source platform I'd hand a startup that wants a real APM without Datadog money. It's built on OpenTelemetry for collection and ClickHouse for storage, which means fast full-text log search and high-cardinality trace queries in a single backend. You get traces, metrics, and logs under one roof, self-hosted for free or on their cloud.
Who it's for: cost-conscious engineering teams that are already OTel-native, and anyone who wants to avoid per-host and per-seat billing entirely.
self-hosting the community edition is free (you pay for your own infra). SigNoz Cloud's Teams plan now starts at $49/month, with usage-based rates of $0.30/GB for logs and traces and $0.10 per million metric samples. Enterprise starts around $4,000/month. Critically, there are no charges for the number of users or hosts.
The standout: the pricing model. Because you pay for data volume, not seats or hosts, a 50-engineer team monitoringhosts doesn't get punished the way it would on a per-host tool. For high-host-count, lower-data workloads, the savings are large.
The catch: it's younger and thinner than the incumbents. The integration catalog is smaller, RUM and synthetics are less mature, and if you self-host, you own the ClickHouse cluster and its scaling headaches. For more open-source picks like this, see my guide to the best open source tools.
New Relic: predictable usage-based billing
New Relic rebuilt its whole model around two simple levers: data ingested and users. There are no per-host charges at all. Unlimited hosts, agents, containers, and cloud functions are included, which is a relief if you run a lot of short-lived infrastructure.
Who it's for: teams that want one bill that's easy to reason about, especially those running large fleets of hosts but moderate data volumes.
GB/month of ingest is free, along with unlimited basic users and one full-platform user. Beyond that it's $0.40/GB ($0.60/GB on Data Plus for longer retention and compliance features). Full platform users are $349/user/year on Pro; core users are $49/user/month. The numbers are on the pricing page.
The standout: that freeGB tier makes evaluation frictionless, and not paying per host removes the most common surprise in observability billing.
The catch: NRQL, New Relic's query language. It's powerful but it's another syntax to learn, and it isn't as widely known as SQL or PromQL, so onboarding new engineers takes longer. The interface has also accumulated a lot of surface area over the years.
Honeycomb: built for debugging the weird stuff
Honeycomb is the platform you reach for when your problems aren't "is the server up" but "why is this one customer's checkout slow only on Tuesdays." It's built around wide, high-cardinality events and fast exploratory queries, so you can slice by any dimension (user ID, region, feature flag) without pre-aggregating.
Who it's for: teams running complex distributed systems who debug by asking questions, not by staring at fixed dashboards.
the free tier covers up to 20M events per month. The Pro plan starts at $130/month for up to 1.5B events, which works out to roughly $1.30 per million events. Every tier includes unlimited seats and unlimited querying, per the pricing page.
The standout: query speed on high-cardinality data, and pricing that doesn't charge you per seat or punish curiosity. You can let your whole team explore without watching a meter.
The catch: it's events-only and opinionated. There's no full infrastructure metrics suite or RUM, so it's usually a complement to a broader platform rather than a one-stop shop. Teams used to dashboard-first monitoring need to adjust to its query-first workflow.
Sentry: error tracking developers actually like
Sentry started as error tracking and is still the best at it, but it has grown into performance monitoring, tracing, session replay, and logs. If your priority is catching and fixing application bugs fast, it's hard to beat. The error grouping is smart, the stack traces are clean, and it links the error straight to the offending commit.
Who it's for: product and application engineering teams that care most about code-level errors and front-end performance.
the free Developer tier includes 5k errors, 5M spans, andreplays per month for one user. The Team plan is $26/month billed annually and adds unlimited users, 50k errors, and third-party integrations. Sentry's Seer AI debugging agent is a separate add-on. See the pricing page for details.
The standout: developer experience. The SDKs are excellent across languages and frameworks, and the error-to-fix loop is the fastest I've used. It's the rare monitoring tool engineers install voluntarily.
The catch: it's not full infrastructure observability. You won't monitor your Kubernetes nodes or network with it. Treat it as your application-layer layer and pair it with something broader for infra.
Dynatrace: enterprise automation at scale
Dynatrace is the heavyweight for large, complex enterprises. Its Davis AI engine does automated root-cause analysis, and its Smartscape topology mapping understands how your services depend on each other in real time. For an org running thousands of hosts across hybrid cloud, that automation pays for itself in reduced firefighting.
Who it's for: large enterprises with sprawling, complex infrastructure and the budget to match.
Dynatrace uses a consumption model (Davis Platform Subscription) where you buy capability units. Full-stack monitoring runs about $0.08/hour for anGrafanaGB host, which is roughly $58/host/month, with memory-tier banding. Logs, synthetics, and security each consume units at published rates. Exact totals depend heavily on negotiated contracts, so contact sales for a real quote.
The standout: Davis AI. When it works, it tells you the root cause instead of handing youBrowse the top AI toolsdashboards and wishing you luck. Few tools automate diagnosis this well.
The catch: cost and complexity. It's overkill for small teams, the capability-unit model is hard to forecast, and getting full value out of it usually means a dedicated platform team. This is enterprise software priced and operated like enterprise software.
How to choose
Start with the question you're actually trying to answer, not the feature list.
If you want one platform that does everything and you'd rather spend money than engineering time, pick Datadog, and turn on cost controls from day one. If you have a strong DevOps team and you care about avoiding lock-in, Grafana Cloud gives you open-source portability with a managed backend.
If cost is the constraint and you're already on OpenTelemetry, SigNoz gets you traces, logs, and metrics without per-host or per-seat fees. If you run many hosts but ingest modest data, New Relic's no-per-host model wins on predictability. For debugging genuinely hard distributed-systems problems, add Honeycomb. If you mostly need application error tracking, Sentry is the easiest yes. And if you're a large enterprise that needs automated root-cause across thousands of hosts, Dynatrace earns its price.
One more thing: instrument with OpenTelemetry regardless of which backend you pick. It keeps your options open, so switching platforms later is a config change instead of a rewrite. If you're building out a broader internal stack, my roundup of the best developer tools and the best AI agents pairs well with whatever you choose here.
If you want a faster way to stay current on tools like these, Dupple X tracks the platforms, pricing changes, and launches that matter to engineering teams, so you're not finding out about a better option after you've signed a two-year contract.
FAQ
What is the best observability platform in 2026?
For most teams, Datadog is the best all-around choice because it covers every signal (metrics, logs, traces, APM, RUM) in one correlated product with 1,000+ integrations. If budget is the main constraint, SigNoz delivers most of the value at a fraction of the cost, and Grafana Cloud is the best pick for teams that want open-source control. The "best" depends on whether you're optimizing for time, money, or portability.
How much does an observability platform cost?
It varies wildly. A small team might spend $500 to $2,000 a month, while a mid-size org runninghosts often lands in the $10,000 to $50,000 a month range, and large enterprises routinely pass $200,000 a year. Datadog charges per host plus data, New Relic charges per GB ingested with unlimited hosts, and SigNoz charges only for data volume. The biggest cost surprises come from high-cardinality custom metrics and unindexed log volume.
Is open-source observability worth it?
Yes, if you have the engineering capacity to run it. SigNoz and the Grafana stack (Prometheus, Loki, Tempo) are genuinely production-grade and can cut your bill dramatically. The trade-off is that you own the storage layer, scaling, and upgrades. Managed versions like Grafana Cloud and SigNoz Cloud give you most of the openness without the operational burden, which is the sweet spot for most teams.
What is OpenTelemetry and why does it matter?
OpenTelemetry (OTel) is the open standard for instrumenting applications to emit traces, metrics, and logs. It matters because it decouples your instrumentation from your backend. You add OTel once, then send that data to Datadog, Grafana, SigNoz, or anything else by changing a config. Around half of organizations are already adopting it, and it's the main reason switching platforms is far less painful inthan it used to be.
Do I need APM, logs, and metrics in the same tool?
Not strictly, but correlation is the main argument for it. When your traces, logs, and host metrics live in one platform, finding the root cause of an incident is much faster because you can jump from a slow trace straight to the relevant logs. Many teams do split it (Sentry for errors, a metrics tool for infra), but if fast incident resolution is your priority, a single correlated backend like Datadog or SigNoz pays off.
