Best AI Data Visualization Tools in 2026
Most "AI data visualization" tools fall into two camps. Either they bolt a chat box onto a heavy BI suite that still needs a data engineer to set up, or they're a thin wrapper around GPT that makes a pretty chart and forgets your data the moment you close the tab. Finding one that actually reads a messy CSV, asks good follow-up questions, and produces a chart you'd put in front of your boss is harder than the marketing pages suggest.
I spent the last few weeks throwing real datasets at the current crop: sales exports, a 40MB event log, a survey with half the columns mislabeled. Some tools cracked under the mess. A few were genuinely faster than me writing the SQL myself.
If you want the short version: for individual analysts and small teams who want to ask questions in plain English and get charts back, Julius AI is the one I reach for first. If you're standardized on Microsoft, Power BI with Copilot is the obvious default. Below is the full breakdown, who each tool is actually for, what it costs, and where it lets you down.
Quick comparison
| Tool | Best for | Price | Standout |
|---|---|---|---|
| Julius AI | Analysts who want a chat-based data scientist | Free / $20 / $45 mo | Writes and runs real Python/R on your files |
| Power BI Copilot | Microsoft-shop enterprises | $14/user + capacity | Copilot inside a full BI suite |
| Tableau Pulse | Large orgs already on Tableau | Tableau+ (sales) | Proactive insight digests |
| ThoughtSpot | Self-serve teams, governed data | From $25/user/mo | Search-first natural language queries |
| Polymer | Marketers, spreadsheet-to-dashboard | Free / $20+/user/mo | Auto-builds dashboards from Sheets |
| Hex | Data teams who live in notebooks | Free / $24/user/mo | Agentic notebook over your warehouse |
| Quadratic | Technical folks who like spreadsheets | Free / $25/mo | Python + SQL + AI in spreadsheet cells |
| ChatGPT (ADA) | Quick one-off analysis | $20/mo | Already in your subscription |
Julius AI: the chat-first data analyst
Julius AI is the tool I'd hand to someone who can describe what they want but can't write the query. You upload a file or connect a database, ask a question in plain English, and Julius interprets it, writes Python or R behind the scenes, runs the code, and hands back a chart plus an explanation of what it did. You can see the code if you want to, which matters when you need to trust the number before you ship it.
What sold me was how it handled a dirty dataset. I gave it a sales export with inconsistent date formats and it flagged the problem, proposed a fix, and re-ran the analysis without me prompting twice. The chart engine covers the usual bar, line, scatter, heatmap and pie outputs, and the charts are interactive: you can hover for values and export to PNG or SVG.
Pricing: Free tier with
Tableau Pulse: insights that come to you
messages a month, Plus at $20/month, and Pro at $45/month, per Julius's pricing page. Students and educators get 50% off. Annual billing saves around 15%.The catch: A "message" is any prompt or follow-up, and a real analysis session burns throughMicrosoft's Fabric documentationto
Tableau Pulse: insights that come to you
of them fast. The free tier is a demo, not a working plan. You'll be on Plus within a day if you use it for actual work. If you want a wider look at this category, my guide to the best AI for data analysis covers the adjacent options.Power BI with Copilot: the enterprise default
If your company runs on Microsoft 365, you've probably already half-decided. Power BI is the BI standard for a reason: deep modeling, governance, row-level security, and an ecosystem nobody else matches. Copilot adds the AI layer, generating report pages from a prompt, summarizing what a dashboard shows in plain language, and writing DAX measures you'd otherwise look up.
For a marketing or ops lead who needs a polished, governed dashboard that IT will actually approve, this is the safe pick. The Copilot summaries are genuinely useful for the "what changed this week" question that stakeholders keep asking.
Power BI Pro is $14/user/month and Premium Per User is $24/user/month, both raised in 2025. The wrinkle is Copilot: it's bundled into Premium Per User, but on a per-user Pro license you need Microsoft Fabric capacity to unlock it. Fabric SKUs start at F2 (around $262/month) and include Copilot, per Microsoft's Fabric documentation.
Where it falls short: The licensing maze is real. Working out whether you need Pro, PPU, or a Fabric capacity to get the AI features takes a spreadsheet of its own. And the learning curve is steep if you're not already a Power BI person. Overkill for a three-person startup that just wants to see its Stripe numbers.
ThoughtSpot: search your data like Google
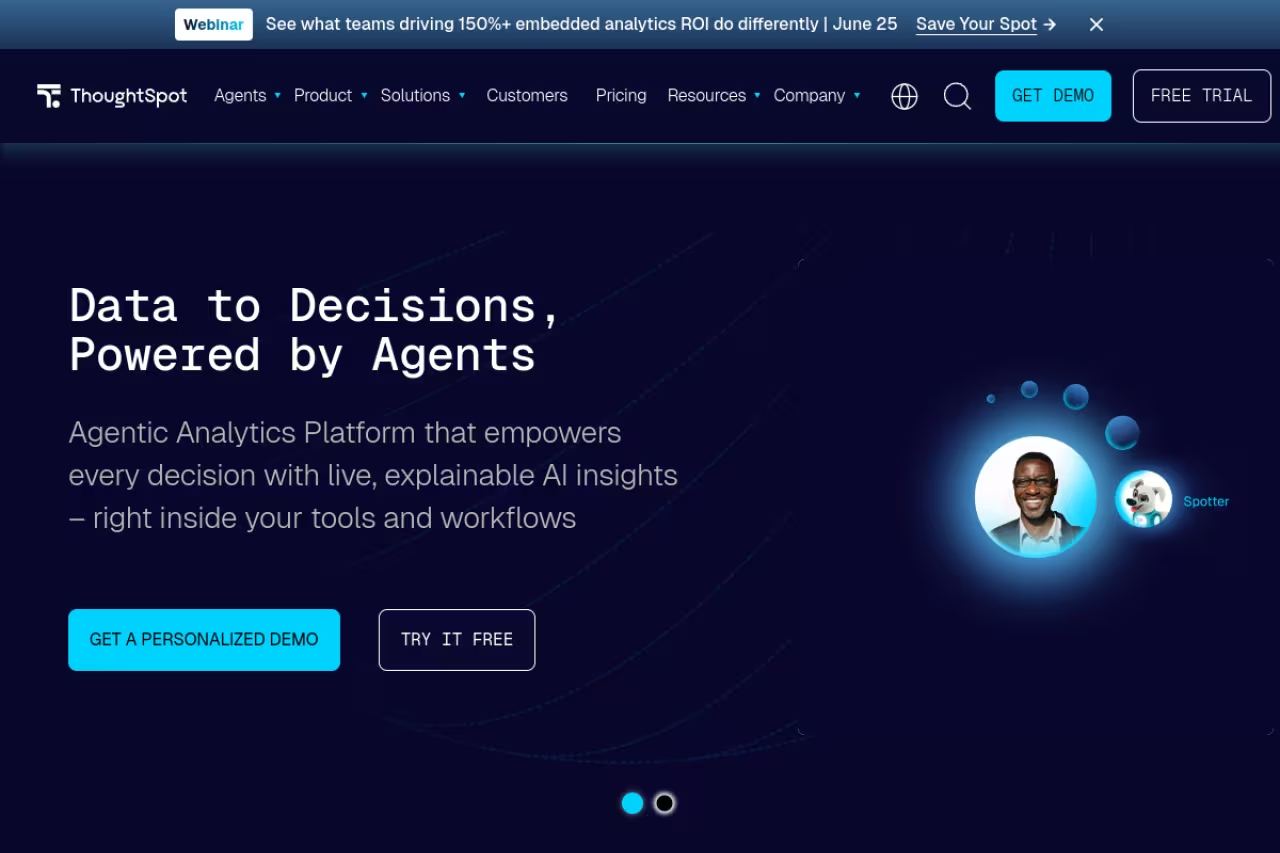
ThoughtSpot built its whole product around the idea that querying data should feel like a search bar. You type "revenue by region last quarter" and it returns a governed chart on live data. Its Spotter AI agent takes that further, handling conversational follow-ups and surfacing anomalies without you asking.
This is the tool for an organization that wants non-technical staff to self-serve answers without pinging the data team every time. The "governed" part matters: answers come from a modeled, trusted dataset, so you don't get the made-up numbers that plague free-text AI tools.
The Essentials plan starts at $25 per user per month billed annually, with Enterprise on custom pricing, per ThoughtSpot's site. Note that Spotter query limits apply on lower tiers, so heavy AI usage pushes you up the ladder.
The catch: ThoughtSpot shines when your data is already modeled and clean. Point it at a raw warehouse with no semantic layer and you'll spend weeks on setup before the magic search bar does anything useful. It's an investment, not a weekend tool.
If you want to move fast on something cheaper, here's where I'd start.
Building your own data product or AI tool? Dupple X gives founders and operators the playbook and tooling to ship faster without a full data team.
Tableau Pulse: insights that come to you
Tableau remains the gold standard for visual craftsmanship. If you care about how a chart looks down to the axis labels, nothing beats it. Tableau Pulse is the AI layer Salesforce added: instead of you opening a dashboard, Pulse sends proactive digests in plain language about what changed in your key metrics, why, and what to watch.
It's best for large organizations already invested in Tableau who want executives to get the headline without logging in. The natural-language metric summaries are well done.
Standard Tableau Creator licensing runs about $75/user/month, but the premium Pulse and agentic features live in the Tableau+ bundle, which is sales-only and meaningfully more expensive. Independent breakdowns like Toucan Toco's pricing guide put Tableau+ well above standard Cloud pricing.
Where it falls short: Cost and complexity. Tableau is a poor fit for small teams, and the best AI features are locked behind the priciest tier with no public price. You're talking to a sales rep before you see a number.
Polymer: spreadsheet to dashboard in minutes
Polymer is the one I'd recommend to a marketer who lives in Google Sheets and breaks out in hives at the word "BI." Connect a sheet, CSV, or a source like Shopify or GA4, and its AI auto-generates a dashboard: it picks sensible visualizations, surfaces trends and anomalies, and lets you share or embed in a few clicks. No modeling, no setup ritual.
For quick, attractive reporting from data you already have in a spreadsheet, it's hard to beat on speed.
A free forever plan exists, with the Starter plan around $20/user/month (cheaper billed annually) and Pro above that. API and embedded-analytics access starts at $500/month for product teams.
The catch: Polymer is built for breadth of access, not depth of analysis. It'll make a clean dashboard, but it won't run a regression or answer a genuinely complex question. It's a presentation layer, not a data science tool. For spreadsheet-native workflows specifically, my best AI for spreadsheets roundup digs deeper.
Hex: the notebook data teams actually like
Hex is where I'd point a real data team. It's a collaborative notebook mixing SQL, Python, and rich visual outputs, connected straight to your warehouse (Snowflake, BigQuery, Redshift, Databricks, Postgres). The AI layer, now an agentic Notebook Agent, writes SQL from a description, explains code, fixes errors, and can draft whole analysis sections from a prompt.
The reason data teams pick Hex over a chat tool is that the output is reproducible and reviewable. You get a notebook a colleague can read, rerun, and trust, not a black-box answer.
A free Community tier supports one user with unlimited notebooks and two published apps. The Team plan is $24/user/month and adds collaboration, version control, and governed sharing, per Hex's pricing page.
Where it falls short: This is a tool for people comfortable with SQL or Python. If you can't read the code the agent writes, you can't catch when it's wrong, and that defeats the point. Non-technical users should look at Polymer or Julius instead.
Quadratic: a spreadsheet that speaks Python
Quadratic is a clever middle ground: an infinite spreadsheet where you can drop Python or SQL directly into cells, draw charts with Plotly, and ask AI to write the analysis for you. It's the answer for someone who thinks in spreadsheets but has outgrown what formulas can do.
The AI assistant understands your grid and can generate code that references specific cells, which feels more natural than copy-pasting into a separate notebook.
Free tier, Starter at $16/month, Pro at $25/month, and Team at $45/seat/month.
The catch: It's younger and smaller than the giants here, so the integration list and polish aren't at Tableau or Power BI levels. The Python-in-spreadsheet idea is great until you hit a missing connector. Best for personal and small-team analysis rather than company-wide reporting.
ChatGPT Advanced Data Analysis: the one you already pay for
Don't overlook the tool sitting in your existing subscription. ChatGPT with Advanced Data Analysis writes and runs Python to examine spreadsheets, JSON, and other files, build charts, run regressions, and find patterns, all inside a $20/month Plus plan you may already have.
For a quick, ad-hoc "what's going on in this file" question, it's the fastest path from data to answer with zero new accounts.
Included in ChatGPT Plus at $20/month.
Where it falls short: It can't render interactive charts in the web interface, so it'll suggest exporting an HTML file instead. There's no persistent dashboard, no governance, and it forgets the context once the chat ends. It's a scratchpad, not a reporting system. For repeated work, see my ChatGPT for Excel guide.
How to choose
Match the tool to the job, not the hype:
- You're a solo analyst or small team with files and questions: Julius AI. Plain-English questions, real charts, code you can verify.
- You're a Microsoft-365 enterprise: Power BI Copilot. The governance and ecosystem make the licensing pain worth it.
- You want non-technical staff to self-serve on governed data: ThoughtSpot, if your data is already modeled.
- You're a marketer reporting from spreadsheets: Polymer. Fastest dashboard with the least setup.
- You're a data team that lives in notebooks: Hex. Reproducible, agentic, warehouse-native.
- You just need a one-off answer today: ChatGPT Advanced Data Analysis. It's already paid for.
The honest rule: if your data is messy and unmodeled, an AI-native tool like Julius or Hex will get you further than a heavy BI suite that needs setup first. If your data is governed and your org is big, the enterprise platforms earn their cost. For more on building data-driven products, the top AI tools directory and my best AI agents roundup are good next stops.
FAQ
What is the best AI data visualization tool in 2026?
For most individual analysts and small teams, Julius AI is the best starting point because it turns plain-English questions into real, verifiable charts using Python and R. For Microsoft-standardized enterprises, Power BI with Copilot is the stronger default thanks to its governance and ecosystem. The "best" depends on whether your data is already modeled and how technical your users are.
Can AI create data visualizations from a spreadsheet automatically?
Yes. Tools like Polymer connect to a Google Sheet or CSV and auto-generate a full dashboard, picking visualizations and surfacing trends without manual setup. Julius AI and ChatGPT's Advanced Data Analysis will read an uploaded file and produce charts on request. Quality varies with how clean your data is, so expect to fix mislabeled columns before the output is trustworthy.
Are free AI data visualization tools any good?
Some are genuinely useful for small projects. Hex's free Community tier supports unlimited notebooks for one user, Polymer has a free forever plan, and ChatGPT's data analysis is included in any Plus subscription. The common limit is volume: Julius's free tier caps you at
Tableau Pulse: insights that come to you
messages a month, which a single analysis session can exhaust. Free plans work for evaluation, not for daily reporting.Do I need to know how to code to use these tools?
No, but it helps. Julius AI, Polymer, ThoughtSpot, and Power BI Copilot are built for people who can't or don't want to write SQL. Hex and Quadratic assume you can read Python or SQL, which is exactly why data teams prefer them: you can verify the AI's work. If you can't check the code, pick a tool where trust comes from a governed dataset instead.
How much do AI data visualization tools cost?
There's a wide range. AI-native tools like Julius ($20 to $45/month) and Quadratic ($16 to $45/month) are accessible to individuals. Enterprise platforms cost more: Power BI is $14 to $24/user/month plus possible Fabric capacity, and Tableau's AI features sit inside the sales-only Tableau+ bundle that runs well into five figures a year for an organization. Match the spend to whether you need a personal tool or company-wide governed reporting.
