The 8 Best Network Monitoring Tools in 2026 (Tested and Compared)
A network problem rarely announces itself politely. A switch port flaps, latency creeps up on one VLAN, an upstream provider quietly drops a route, and the first you hear about it is a support ticket that says "the internet is slow." Good network monitoring is the difference between knowing about that before your users do and finding out an hour later from an angry Slack channel.
I've run small office networks and helped debug multi-site WANs, and I've used most of the tools below in anger. The market in 2026 splits into roughly three camps: agentless platforms that auto-map your infrastructure (good for MSPs and lean IT teams), full observability suites that fold network data into metrics, traces and logs (good for cloud-native engineering orgs), and open-source systems you self-host to avoid per-device fees (good if you have the time).
If you want a fast answer: Auvik is the one I'd hand to most IT teams and MSPs because it maps your network for you and bills per billable device. If you already live in Datadog, add its network module instead of buying a second tool. And if budget is the constraint, Zabbix is free and genuinely capable. Here's the full breakdown.
Quick comparison
| Tool | Best for | Price | Standout |
|---|---|---|---|
| Auvik | MSPs and lean IT teams | Quote, per billable device | Automatic network topology mapping |
| Datadog | Cloud-native engineering orgs | From $15/host/mo + network module | Network data inside full observability |
| PRTG | SMBs wanting one self-hosted box | Free to ~$1,726/yr (PRTG 500) | Sensor-based flexibility |
| LogicMonitor | Hybrid enterprise infra | From $16/hybrid unit/mo | Agentless auto-discovery at scale |
| Zabbix | Budget-conscious, technical teams | Free (open source) | No per-device cost, total control |
| ManageEngine OpManager | SMB on-prem networks | Free (3 devices) to $345+/yr | Cheap perpetual licenses |
| Kentik | Large hybrid/multicloud networks | Custom | Flow and BGP-level traffic intelligence |
| Checkmk | Mixed on-prem and hybrid estates | Free tier + paid editions | Fast auto-discovery, low overhead |
Auvik: the easiest network mapping I've used

Auvik is a cloud-based network monitoring and management platform built around one trick it does better than almost anyone: you point it at your network, it discovers every device, and it draws you a live topology map. No manual diagramming, no guessing how things connect. For a new IT hire inheriting an undocumented network, that map alone justifies the tool.
Who it's best for: managed service providers and internal IT teams who manage networks rather than build software. The multi-tenant design means MSPs can watch dozens of client sites from one dashboard.
Auvik uses per-device billing and publishes a quote-based model rather than a fixed list price. The smart part is that it only charges for "billable" devices like switches, routers and firewalls. Wireless access points, printers, UPS units and similar gear are monitored at no extra cost, per Auvik's pricing page. There's a 14-day free trial with no credit card.
The standout: automatic topology mapping plus configuration backup. When someone changes a switch config and breaks routing, Auvik keeps the previous version so you can diff and roll back.
The catch: the quote-based pricing makes budgeting annoying. You can't sanity-check the cost without talking to sales, and per-device pricing climbs fast on dense networks. It's also focused on network infrastructure, so it's not a full server-and-application observability tool.
Datadog: network data inside one observability pane
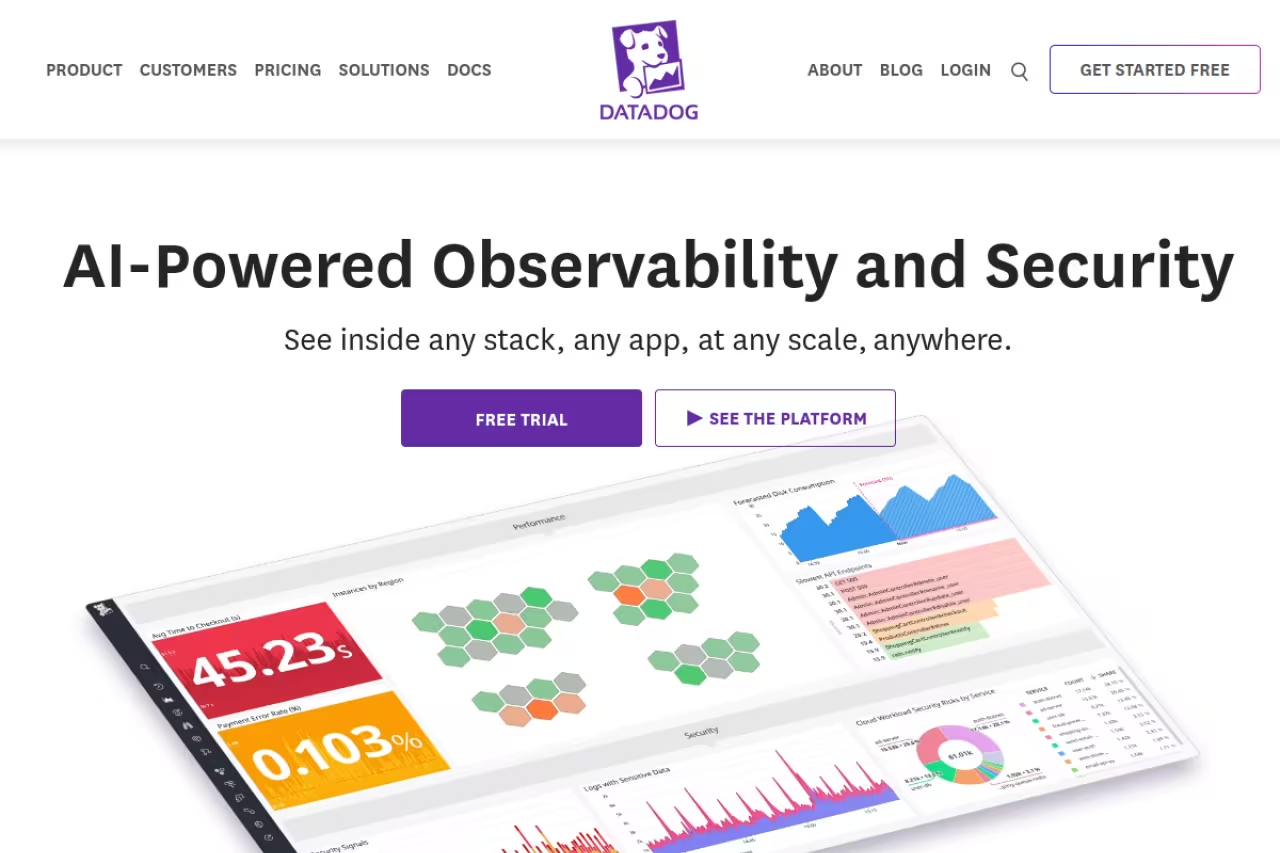
If your team already uses Datadog for application and infrastructure monitoring, buying a separate network tool is usually a mistake. Datadog offers Network Performance Monitoring (flow-level visibility between services, containers and hosts) and Network Device Monitoring (SNMP-based monitoring of switches, routers and firewalls) as add-on modules to the same platform.
Who it's best for: cloud-native and DevOps teams who want network telemetry correlated with traces, logs and host metrics in the same place. When a service slows down, you can see whether the cause is the app or the network path without switching tools.
Datadog's infrastructure monitoring starts at $15 per host per month billed annually (the Pro tier), per the official pricing page, with the network modules billed as consumption-based add-ons on top. That layering is the gotcha: independent breakdowns regularly report mid-sized networks landing well into five figures per month once every module and data-ingest charge stacks up.
The standout: correlation. Seeing a TCP retransmit spike next to the exact deploy that caused it, in one timeline, is something single-purpose network tools can't match.
The catch: the bill. Datadog's consumption-based model is famous for surprise invoices, and the network modules add another metered line item. For a pure network monitoring need with no existing Datadog footprint, it's overkill and overpriced.
PRTG: one self-hosted box, sensor by sensor

Paessler PRTG has been a staple of SMB IT for years because of its sensor model. You don't pay per device, you pay per "sensor," where a sensor is a single monitored metric: one ping, one port's traffic, one CPU reading. A typical device uses 5 to 10 sensors. It runs on your own Windows server, so your monitoring data stays in-house.
Who it's best for: small and mid-sized businesses that want agentless monitoring across SNMP, NetFlow, WMI and more from a single self-hosted install, without a SaaS subscription.
the free version monitors up to 100 sensors, which is genuinely useful for a small shop. Paid licenses are priced by sensor count: PRTG 500 (500 sensors) runs around $1,726/year and PRTG 1000 around $3,049/year, per aggregated pricing data, scaling up to the PRTG 10,000 tier for larger estates.
The standout: flexibility. The sensor model means you can monitor almost any metric you can define, and the free 100-sensor tier is one of the most generous in the category.
The catch: sensor counting gets fiddly at scale. Dense environments burn through sensors faster than you'd expect, and the cost-per-sensor math turns into a planning exercise. The interface also feels dated next to cloud-native rivals.
If you're standing up internal tooling and weighing self-hosted versus SaaS across your stack, our guide to the best AI agents covers the same build-versus-buy tension from the automation side.
LogicMonitor: agentless monitoring built for hybrid scale
LogicMonitor is a SaaS platform aimed at enterprises running a mix of on-prem hardware, cloud resources and SaaS. Its auto-discovery is the selling point: drop a collector on your network and it finds and starts monitoring devices automatically, with thousands of prebuilt integrations.
Who it's best for: mid-market and enterprise IT teams with hybrid infrastructure who want one platform across network, server and cloud without managing the monitoring backend themselves.
LogicMonitor prices by "hybrid unit." Published 2026 rates start at $16 per hybrid unit per month for Essentials, $27 for Advanced and $53 for Signature, billed annually. One hybrid unit equals one on-prem device, or one cloud IaaS resource, or seven cloud PaaS resources, or five wireless access points. Real contracts average roughly $36,000/year according to Vendr transaction data.
The standout: breadth. Few tools cover network, infrastructure and cloud this evenly, and the auto-discovery genuinely reduces setup time on large estates.
The catch: the hybrid unit abstraction makes pricing hard to forecast until you map your inventory to it, and it's enterprise-priced. Small teams will find it heavy and expensive.
Zabbix: free, open source, and surprisingly deep
Zabbix is the open-source heavyweight. It monitors networks, servers, cloud, containers and more, and the on-premise version is 100% free with no device caps and no feature paywalls. You self-host it, you configure it, and you own your data completely.
Who it's best for: technical teams with the time to run their own monitoring stack, and anyone allergic to per-device SaaS fees. It scales to tens of thousands of monitored items if you tune it.
free for the self-hosted software. Zabbix sells optional paid support subscriptions, professional services and a managed Zabbix Cloud offering for teams that want a backstop, but you never have to pay to use the core product.
The standout: zero licensing cost with enterprise-grade capability. The same feature set behind a paywall elsewhere is free here.
Where it falls short: the time tax. Setup, templating and tuning take real effort, and the learning curve is steeper than any SaaS option. The interface, while much improved, still feels engineer-first rather than polished. If nobody on your team wants to own it, the "free" tool gets expensive in hours.
ManageEngine OpManager: cheap licenses for on-prem networks
ManageEngine OpManager is a practical, no-drama network monitoring tool that's been around long enough to be boring in the best way. It does SNMP-based device monitoring, fault management, performance dashboards and network mapping, and it's notably cheap.
Who it's best for: SMBs running on-prem networks who want a self-hosted tool with a low entry price and the option of a perpetual license instead of a subscription.
there's a free edition for up to 3 devices. Paid editions start cheap: the Standard subscription is around $95/year and Professional around $145/year, with device-based perpetual licenses starting near $245 for up to 25 devices, per ManageEngine's editions page. The Enterprise edition jumps to several thousand for large deployments.
The standout: value. Few commercial tools let a small team get real network monitoring running for under a couple hundred dollars a year.
The catch: it shows its age. The UI is dated, the modules can feel bolted together, and the upsell into ManageEngine's wider product family is constant. Cloud and modern observability use cases are not its strength.
Kentik: traffic intelligence for big networks
Kentik plays a different game. It's a network observability platform built for large hybrid and multicloud networks, ingesting flow records (NetFlow, sFlow), BGP routing data, device metrics and synthetic tests to answer not just "is it down" but "what changed, where, who's affected, and why."
Who it's best for: large enterprises, ISPs and infrastructure-heavy companies whose problems are about traffic patterns, peering, DDoS and internet path performance rather than pinging a handful of switches.
custom, quote-based. This is an enterprise platform and it's priced like one.
The standout: depth of traffic and routing analysis. Kentik sees the internet-facing and inter-cloud picture that device-centric tools simply don't capture, and its newer AI-assisted investigation features speed up root-cause work.
The catch: it's far more than a small or mid-sized network needs, and the price reflects that. If your network is a few sites and some cloud VPCs, Kentik is the wrong size.
Checkmk: fast auto-discovery, light footprint
Checkmk is a network and infrastructure monitoring platform that balances open-source roots with commercial editions. It's known for efficient data collection, fast auto-discovery and low overhead, covering networks, servers, applications and cloud with both agent-based and agentless monitoring.
Who it's best for: teams with mixed on-prem and hybrid estates who want strong coverage without the resource cost of heavier platforms. It's a common Zabbix alternative for people who want less manual configuration.
there's a free Raw edition (open source) plus paid Enterprise and Cloud editions priced by monitored services, with a free trial. The paid tiers add features like the official agent, scaling and support.
The standout: auto-discovery speed and efficiency. Checkmk gets a useful baseline running quickly and stays light on the monitoring server even at scale.
The catch: the free Raw edition lacks some of the polish and features of the paid editions, and the upgrade path can be confusing. Its rule-based configuration is powerful but has its own learning curve.
How to choose
Skip the feature-matrix paralysis and answer three questions.
What kind of team are you? If you manage networks (IT/MSP), start with Auvik or LogicMonitor for the auto-mapping. If you build software and already run observability, add Datadog's network module rather than buying a separate tool. If you're a budget-driven technical team, Zabbix or Checkmk.
SaaS or self-hosted? SaaS (Auvik, Datadog, LogicMonitor, Kentik) means less to maintain but recurring per-unit fees and your data off-site. Self-hosted (PRTG, Zabbix, OpManager, Checkmk Raw) means lower or zero licensing but you run the box. Regulated environments often force the self-hosted answer.
How big is the network, really? Under ~100 sensors or 3 devices, the free tiers of PRTG and OpManager cover you for nothing. A few sites and some cloud, the SMB tools fit. Hundreds of devices across hybrid cloud or internet-scale traffic, you're in LogicMonitor, Kentik or Datadog territory and you should budget accordingly.
Run a free trial on your actual network before committing. Auto-discovery either works smoothly on your gear or it doesn't, and you'll know within an afternoon.
If you're assembling a wider stack of operational and AI tooling around this, the curated top tools directory and our Dupple X bundle are good next stops. For teams layering automation on top of monitoring, the best AI for coding roundup pairs well with infrastructure work.
Want more breakdowns like this delivered weekly? Try Dupple X and get the tools and tactics we'd actually pay for.
FAQ
What is the best network monitoring tool in 2026?
For most IT teams and MSPs, Auvik is the strongest all-round pick because its automatic topology mapping and per-billable-device pricing get you useful monitoring fast. Cloud-native engineering teams are better served by adding Datadog's network module to their existing stack, and budget-driven technical teams should look at Zabbix, which is free and open source.
What is the best free network monitoring tool?
Zabbix is the most capable fully-free option since the self-hosted version has no device caps or feature paywalls. If you want something lighter to configure, Checkmk's Raw edition is also free and open source. For a quick self-hosted start, PRTG's free tier covers up to 100 sensors and ManageEngine OpManager's free edition covers up to 3 devices.
How much does network monitoring software cost?
It ranges widely. Free open-source tools like Zabbix cost nothing in licensing. SMB tools like PRTG run roughly $1,700 to $3,000 per year for a few hundred sensors. Enterprise SaaS platforms like LogicMonitor average around $36,000 per year, and consumption-based tools like Datadog can reach five figures per month for mid-sized networks once every module is added.
What is the difference between network monitoring and network observability?
Network monitoring tells you whether devices and links are up and how they're performing, usually through SNMP polling and pings. Network observability goes further, ingesting flow records, routing data and synthetic tests so you can explain what changed, where, and who's affected across hybrid and cloud paths. Tools like Kentik sit firmly in the observability camp, while OpManager and PRTG are classic monitoring tools.
Do I need a separate network tool if I already use Datadog?
Usually not. Datadog offers Network Performance Monitoring and Network Device Monitoring as add-on modules to its existing platform, so you can get flow-level and SNMP-based device visibility inside the same dashboards as your apps and infrastructure. The trade-off is cost, since both modules add consumption-based charges on top of the per-host base price.
Which network monitoring tool is best for an MSP?
Auvik is the most popular choice for managed service providers thanks to its native multi-tenant architecture, which lets you monitor many client sites from one console, plus per-device pricing with volume discounts. LogicMonitor is a strong alternative for MSPs managing larger hybrid environments that need server and cloud coverage alongside the network.
