Last updated: May 2026
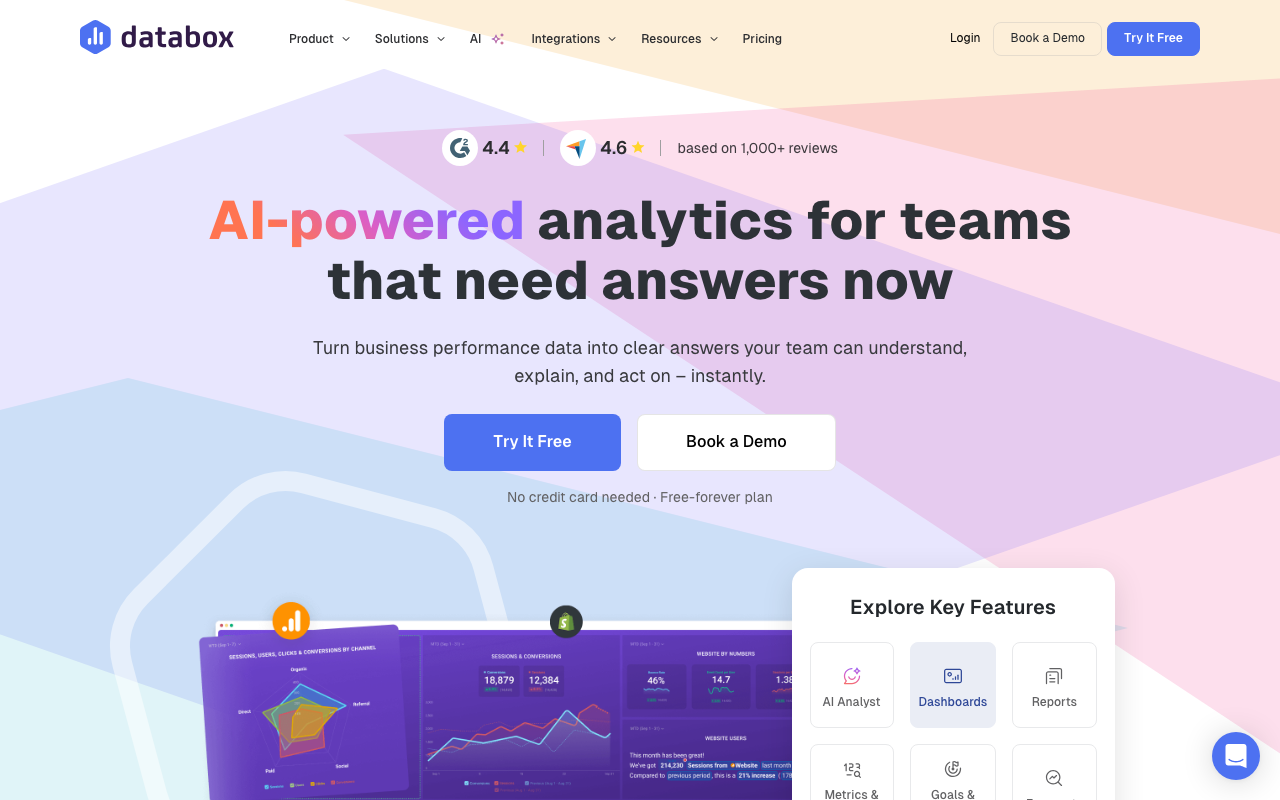
What Is Databox?
Databox is the analytics dashboard platform that consolidates data from 100+ sources into unified business dashboards. Founded in 2014, Databox serves over 20,000 companies, mostly marketing agencies and SMB marketing teams who need to combine metrics from HubSpot, Google Analytics, Facebook Ads, Salesforce, and dozens of other tools into single views.
The pitch is consolidation. Marketing data lives in 12+ tools by the time you count ad platforms, analytics, CRMs, email tools, and customer success software. Building unified reports manually requires a data analyst and weeks of work. Databox provides pre-built connectors and template dashboards that consolidate everything in hours, not weeks.
The product targets marketing agencies reporting to clients monthly and SMB marketing teams who need executive dashboards. Enterprise teams often use Tableau or Looker for similar consolidation at higher cost and complexity.
Try Databox FreeHow Databox Works
Connect data sources via OAuth or API keys. The library covers 100+ sources: Google Analytics 4, Google Ads, Facebook Ads, HubSpot, Salesforce, Stripe, Shopify, Mailchimp, Slack, Pipedrive, and dozens more. Each connection pulls historical data and ongoing updates.
Build dashboards from drag-and-drop tiles. Each tile shows a metric (sessions, revenue, leads, MRR) with visualization options (line chart, bar chart, big number, table). Pre-built tile templates speed up creation; custom calculations support derived metrics.
Goal tracking and alerting layer onto dashboards. Set targets per metric (sessions goal, MRR goal); progress visualizations show how you are tracking. Alerts notify when metrics cross thresholds.
Scoreboards rank performance across team members, locations, or campaigns. Agencies use scoreboards to track multiple clients; sales teams use them for rep performance.
Sharing options include public dashboards, password-protected client links, scheduled email reports, and Slack/Teams updates. Agencies share branded dashboards with clients; in-house teams share with executives.
Databox Pricing in 2026
Free: 3 dashboards, 3 data sources, weekly refresh. Trial-grade.
Starter: $59/month annually. Unlimited dashboards, hourly refresh, 5 data sources.
Professional: $169/month annually. 35 data sources, custom branding, white-label.
Premium: $399/month annually. 60 data sources, advanced security, dedicated CSM.
Performer: Custom pricing. Unlimited everything for high-volume usage.
See Databox PlansWhere Databox Wins
- Pre-built integrations: 100+ sources often easier than building in Looker Studio.
- Mobile dashboards: stronger mobile experience than most competitors.
- Goals and alerts: built-in performance management beyond pure reporting.
- Agency-friendly: white-label and client management features.
- Template library: ready dashboards for common use cases (SEO, paid ads, ecommerce).
Where It Falls Short
- Limited custom calculations: complex derived metrics need raw data exports.
- Pricing scales with sources: lots of integrations means higher tier.
- Data refresh delays on lower tiers: real-time on top tier only.
- Less customization than Tableau: pre-built tile model has limits.
Databox vs Looker Studio vs Klipfolio vs AgencyAnalytics
Looker Studio (Google) is free and flexible. Requires more setup, no native integrations beyond Google products.
Klipfolio is similar scope with weaker UX.
AgencyAnalytics targets marketing agencies with stronger client-reporting features.
Tableau and Power BI are enterprise BI tools with more depth but higher complexity.
Who Should Use Databox
Marketing teams consolidating multi-tool data: pre-built blocks save time.
Agencies reporting to clients: white-label and automated reporting fit.
SMBs needing executive dashboards: from scattered tools to unified views.
Skip it if: you live primarily in Google Analytics + Sheets (Looker Studio is free), you need a real data warehouse (use Metabase or Looker), or you only have 1-2 data sources to track.
Frequently Asked Questions
Can I share dashboards with clients?
Yes. White-label sharing on Professional plans.
How often does data refresh?
Varies by tier. Weekly on free, hourly on Starter, real-time approaches on Premium.
Does it support custom data sources?
Yes via API and custom integrations on Professional and above.
Can I export to PDF?
Yes. Scheduled PDF reports email automatically.
What about mobile?
Strong mobile app for iOS and Android. Dashboards optimized for mobile viewing.