Edgeful review

What edgeful actually is
edgeful is a trading data platform that shows how often a specific market setup has worked in the past. A trader picks a ticker, a time window, and a trading session, and edgeful returns the historical numbers for that setup: how often it happened, how often it followed through, and how far price usually moved.
Futures are its main focus. edgeful also covers stocks, ETFs, forex, and crypto.
As day trading software, edgeful gives a trader a set of numbers to plan around. The automated algos, covered further down, are the one part of edgeful that places trades, and only on settings the trader chooses.
150+ reports that show how often a trading setup has worked
The reports are the core of edgeful. There are more than 150 of them, and each one measures one specific pattern in price.
A few examples, in plain terms:
- Gap fill. A "gap" happens when a market opens above or below where it closed in the previous session. The gap fill report shows how often price traded back to that prior close.
- Opening range breakout (ORB). The "opening range" is the high and low of the first few minutes of the session. This report shows how often price broke above or below that range, and in which direction.
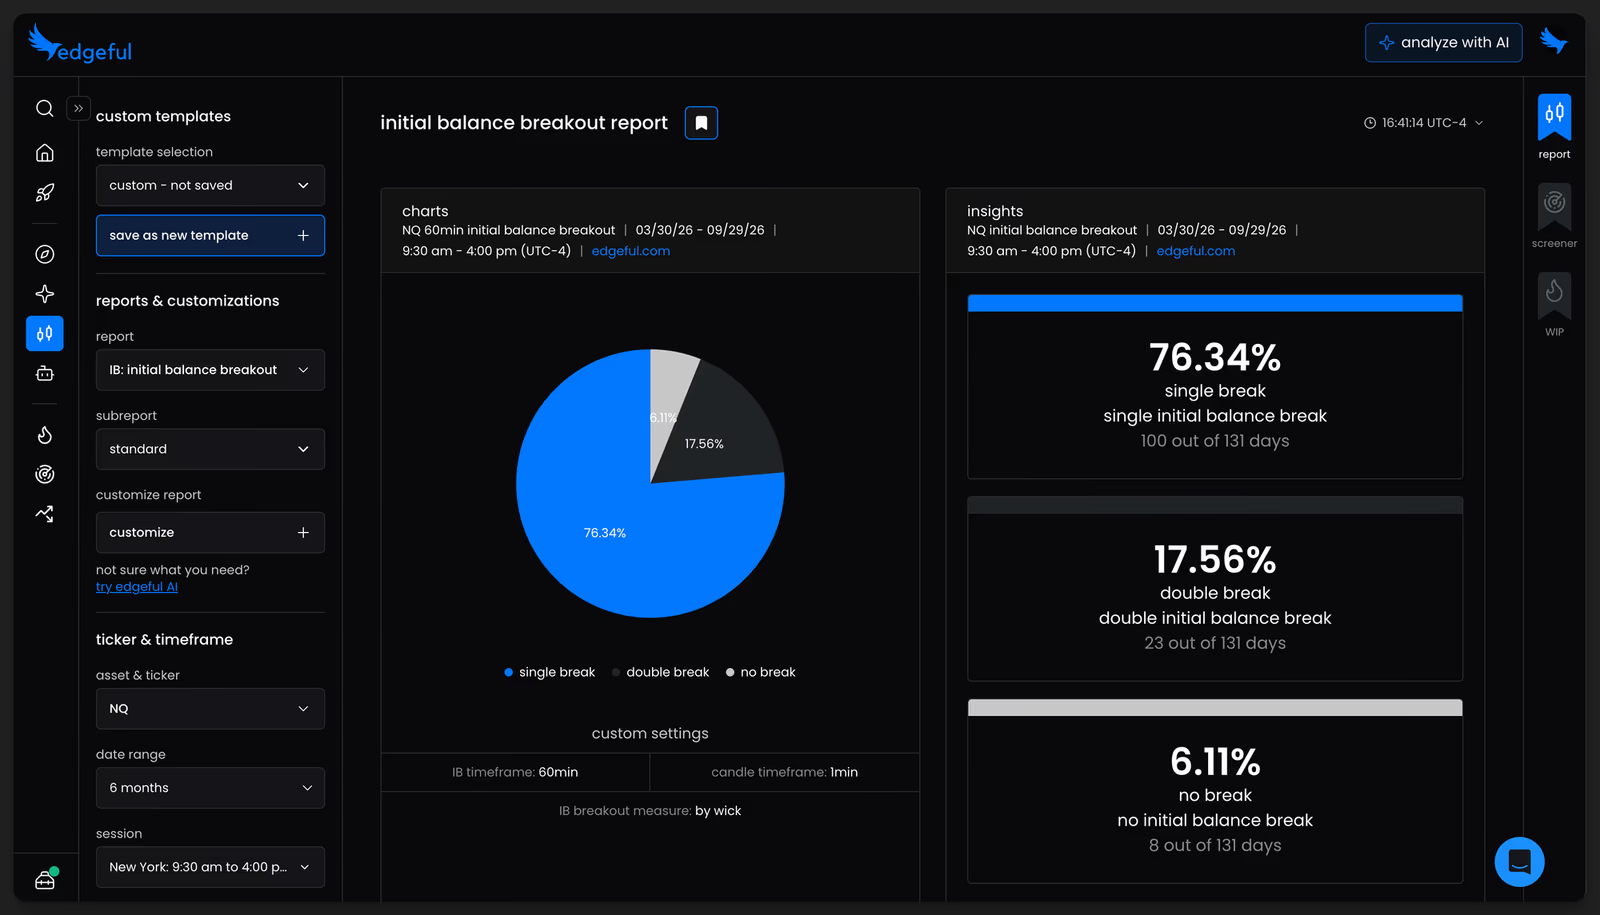
- Initial balance (IB). The high and low of the first hour of trading. The report shows whether price broke one side of that range, both sides, or neither.
Every report can be filtered by ticker (the short code for a market, like ES), date range, and session. A "session" is the block of hours being measured: New York (9:30AM to 4:00PM ET), London, Asian, or a custom window. The default lookback is 6 months.
Here is what a real result looks like.
Over the 6 months from March 27 to September 25, 2026, in the New York session, ES broke only one side of its initial balance on 90 of 130 sessions (69.2%). It broke both sides on 33 sessions, and it didn't break either side on 7.
Most reports also have "subreports" that split the same data into smaller groups: by weekday, by the size of the move, or by how far price went against a position before turning around. These subreports are primarily built to help you find data-backed profit target and stop loss levels.
For example, on NQ in the New York session, from March 25 to September 24, 2026, gaps smaller than 0.4% of price filled all the way 92.9% of the time (52 of 56). Gaps of 0.4% or bigger filled 26.7% of the time (20 of 75).
Those numbers change with the market, and edgeful recalculates them as new sessions come in.
What else it does
What's in play and the screener
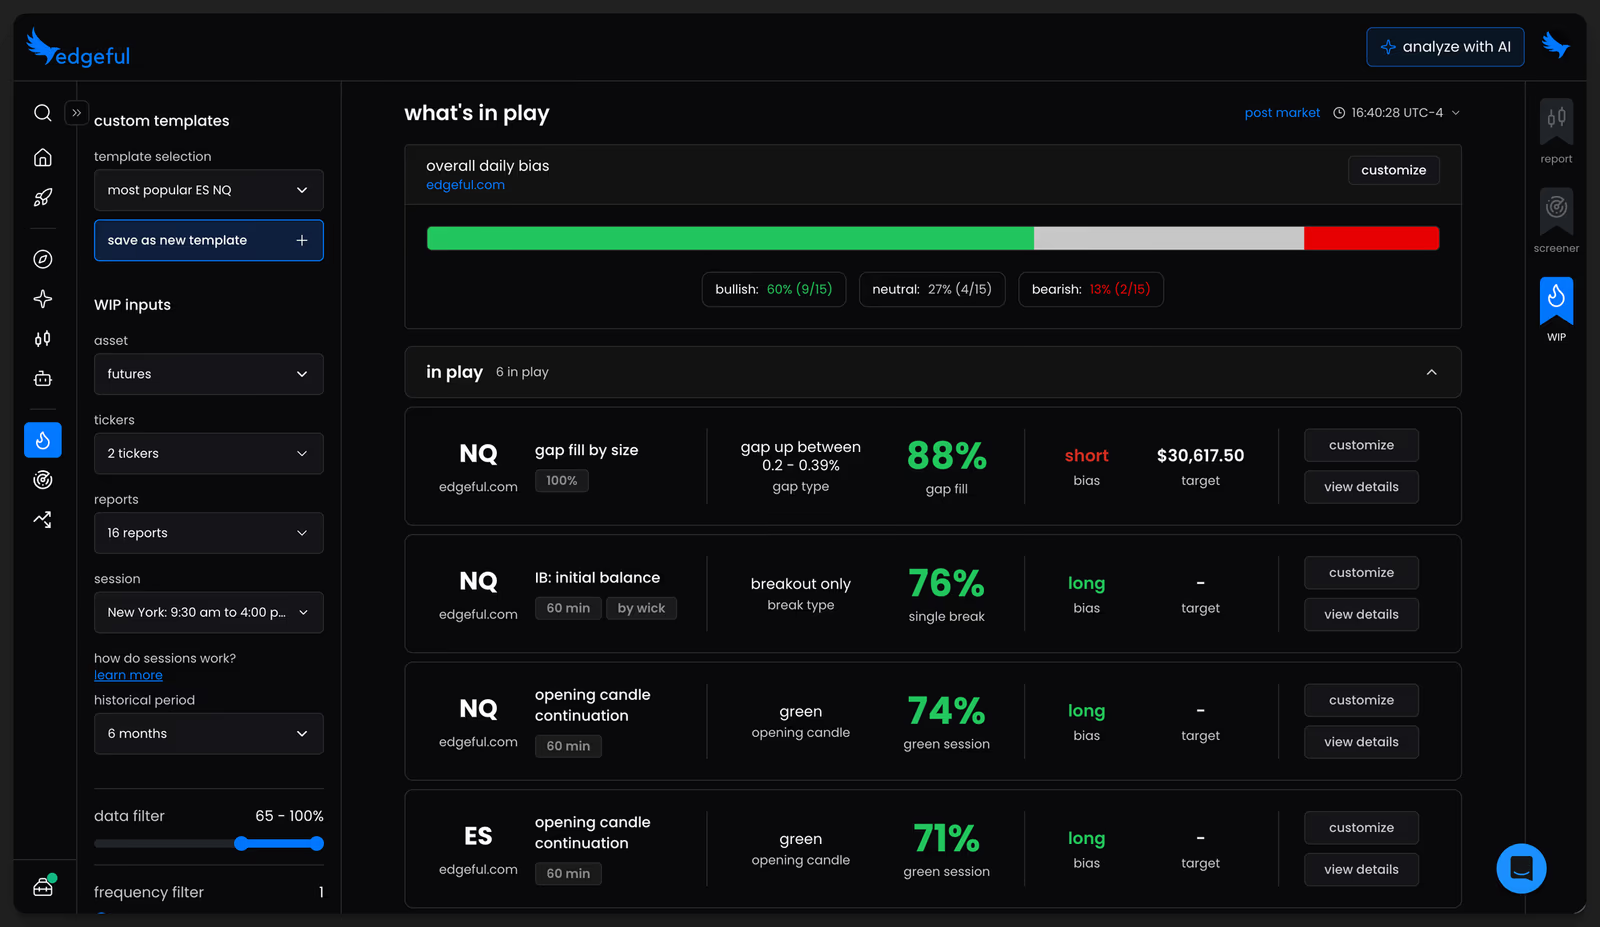
The what's in play dashboard shows those same reports on the current day's live data. It goes live at 9:30AM ET, the New York open, and shows one ticker at a time with a card for each report the trader follows: the current gap and its fill target, the first-hour range, the ORB, and a bullish or bearish bias for each (bullish means the data points to price going up, bearish to price going down).
A card clears once its setup is no longer in play, like a gap that has already filled.
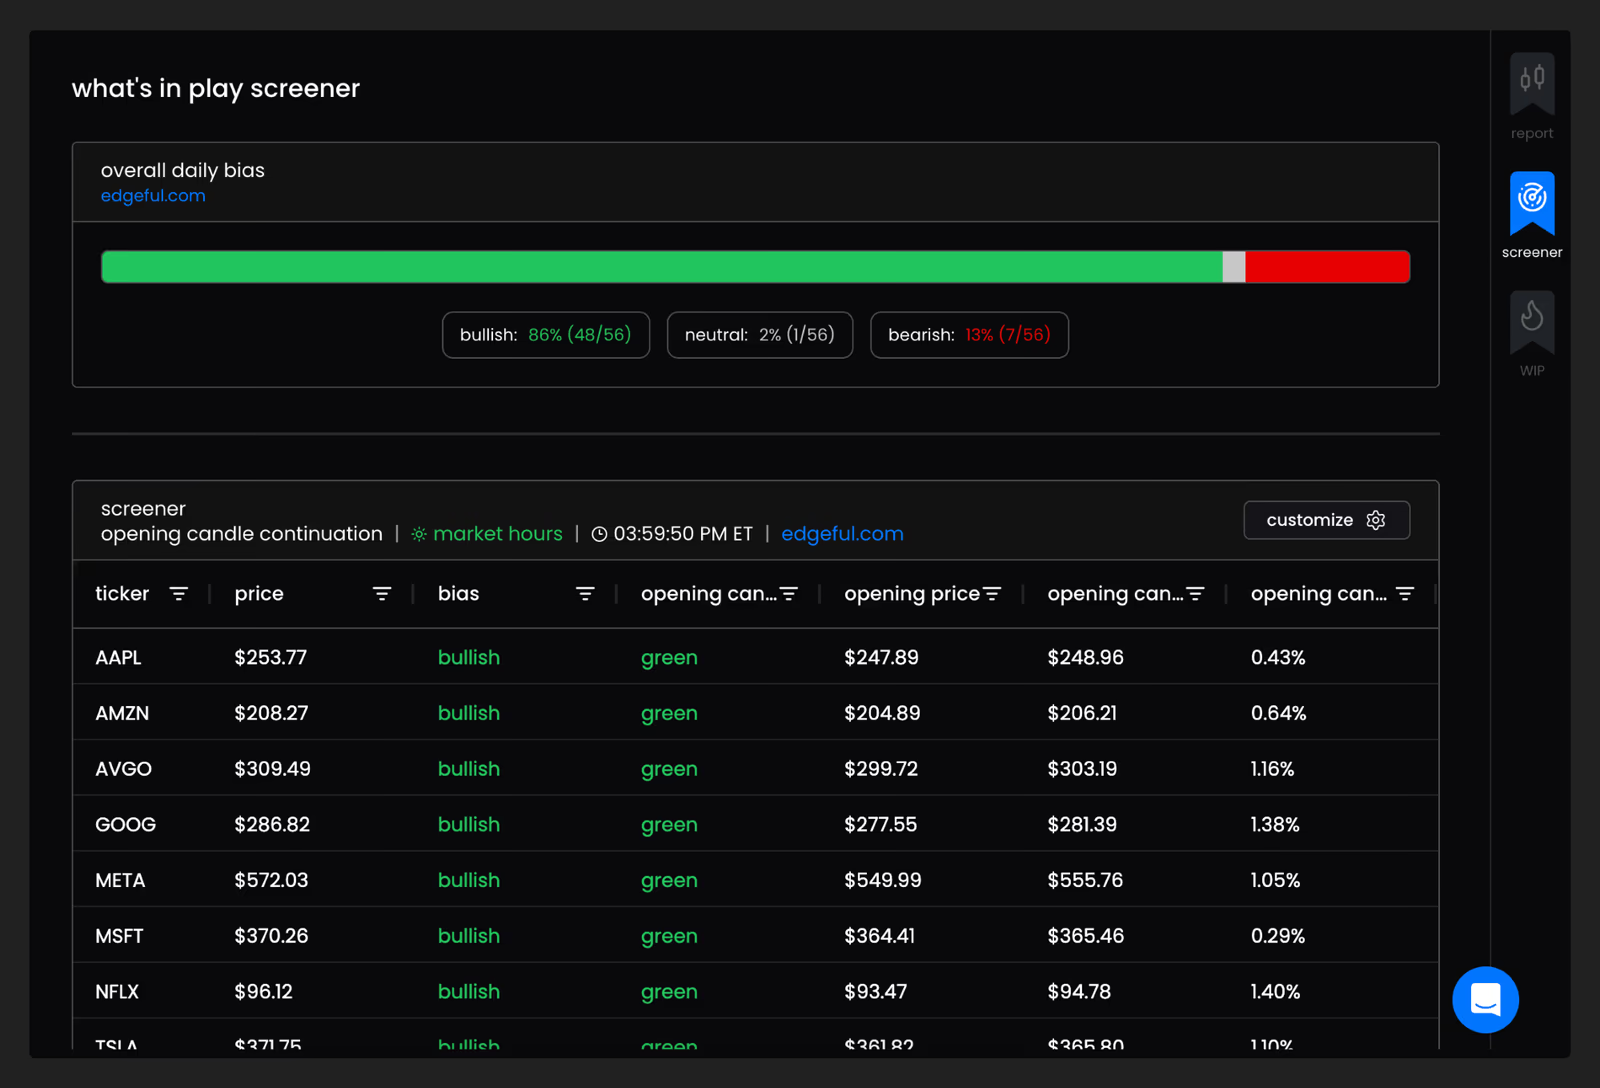
The screener does the same across many markets at once. It tracks up to 49 tickers across 4 report slots, with templates for the morning, a daily bias, and the end of the day. A daily bias bar at the top adds up all the bullish and bearish readings into one bar. A mixed bar means the reports disagree with each other that day.
TradingView indicators
TradingView is the charting site most retail traders already use. edgeful includes 50+ TradingView indicators with every plan, and they draw report levels straight onto the chart: the initial balance high and low, the opening range, the gap fill level, session boxes, and more. 12 NinjaTrader indicators are available too.
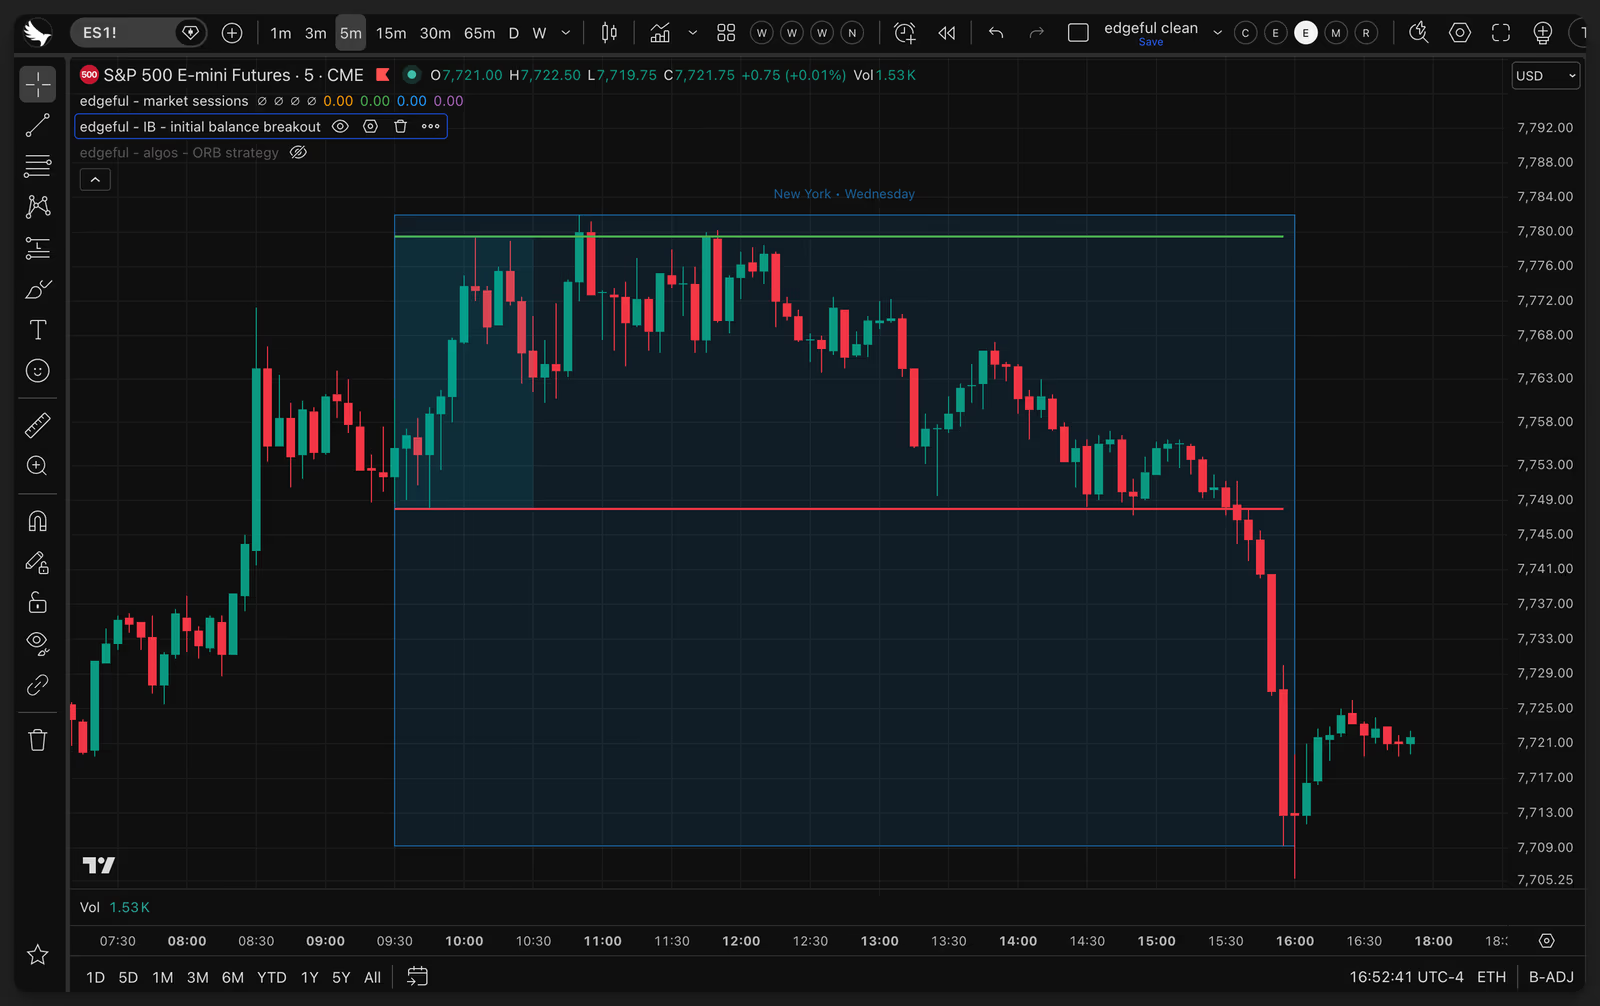
Access is invite-only. A member enters their TradingView username in the edgeful dashboard and the indicators appear in TradingView. The two platforms don't sync settings, so a trader who changes the session or timeframe in edgeful has to change it in TradingView by hand.
edgeful AI and the custom report builder
edgeful AI is the platform's built-in AI trading assistant. It's trained on 8+ years of verified market data, and it analyzes all of edgeful's 150+ reports in real time. A trader asks a question in plain language and edgeful AI answers it with the numbers from those reports.
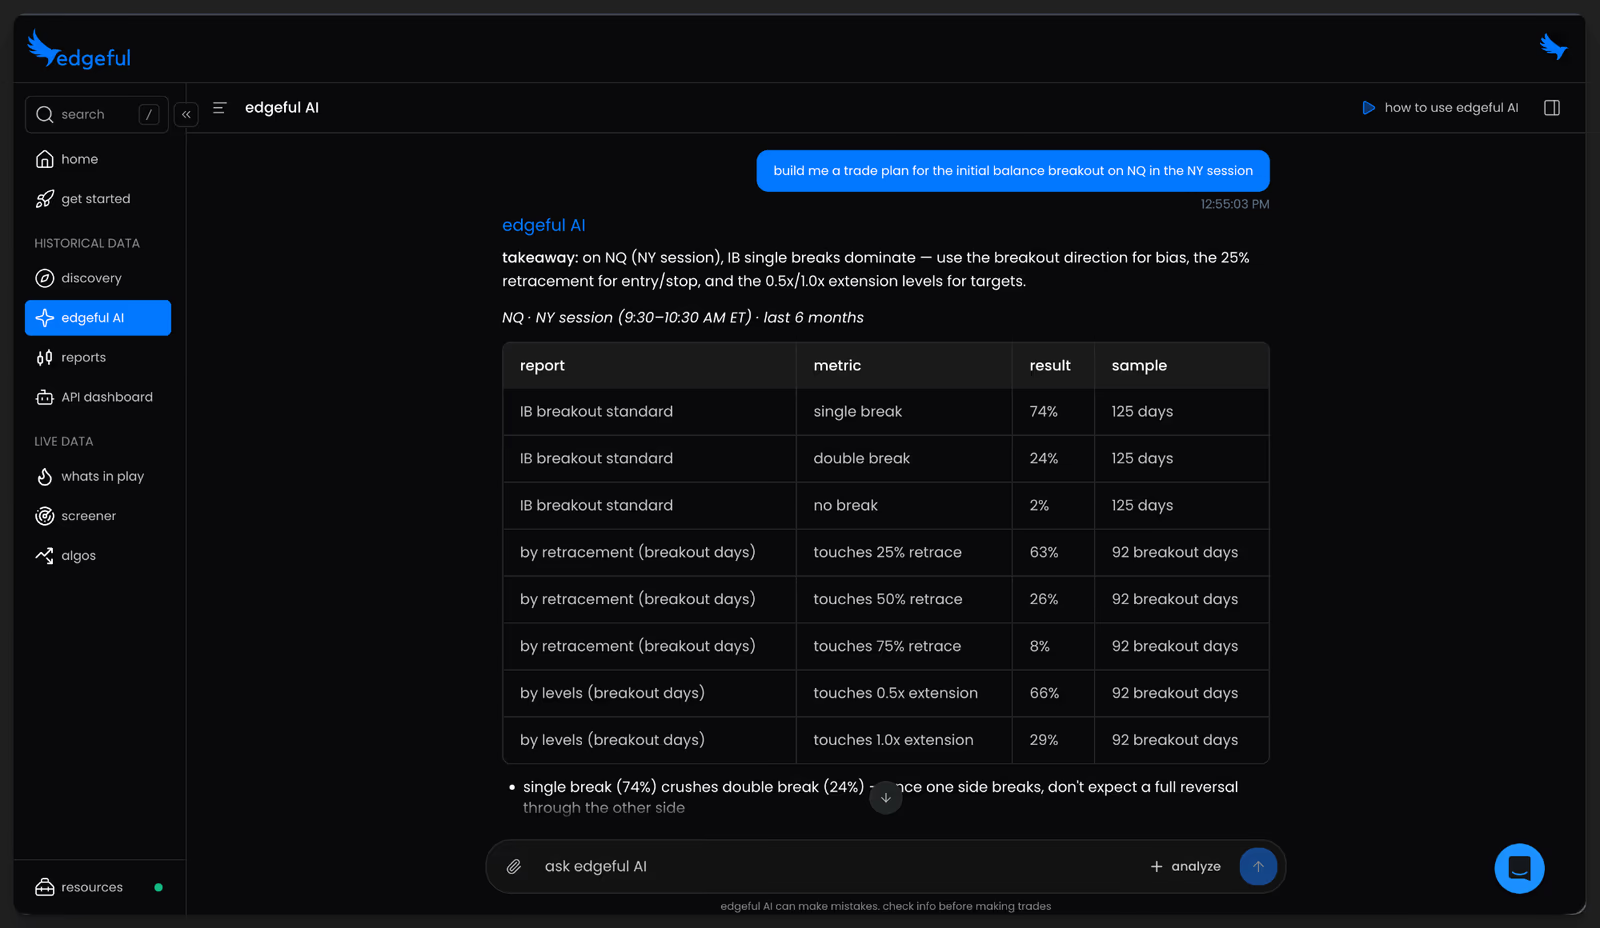
The questions it handles well are the ones that would take hours in a spreadsheet: "tell me every day the NQ gap didn't fill and find what those days have in common," or "which weekday has the most double breaks of the initial balance on ES." It works best as a research tool for studying setups after the session, while the what's in play dashboard and the screener cover the live trading day.
The custom report builder went live inside edgeful AI on August 15, 2026. It lets a trader build a report that doesn't exist yet by describing it, in the form "how often does X happen." A few examples: how often Friday makes the high of the week, how often the low of the day forms between 11:00 and 11:15AM, and what a stock does on the day after 3 green days in a row. An "improve prompt" button cleans up a rough question. Before saving, the builder shows the methodology, the customization options, and a sample results table, and the trader approves it or asks for fixes. Custom reports work on stocks as well as futures, on timeframes from daily down to 5 minutes.
Automated algos, the optimizer, and the analyzer
This is the part of edgeful that places trades. edgeful has 3 foundational strategies (ORB, IB, and engulfing candles, where one candle's body fully covers the candle before it) and 7 automated algos built on them. An "algo" here is a rules-based strategy: it enters, sets a profit target (the price where a winning trade gets closed) and a stop loss, and exits on fixed rules. The algos run as TradingView strategies with settings a trader can change without writing code, and they connect to Tradovate, NinjaTrader, or ProjectX. ProjectX is how many prop firm accounts connect. A "prop firm" lets traders trade the firm's capital under a set of account rules.
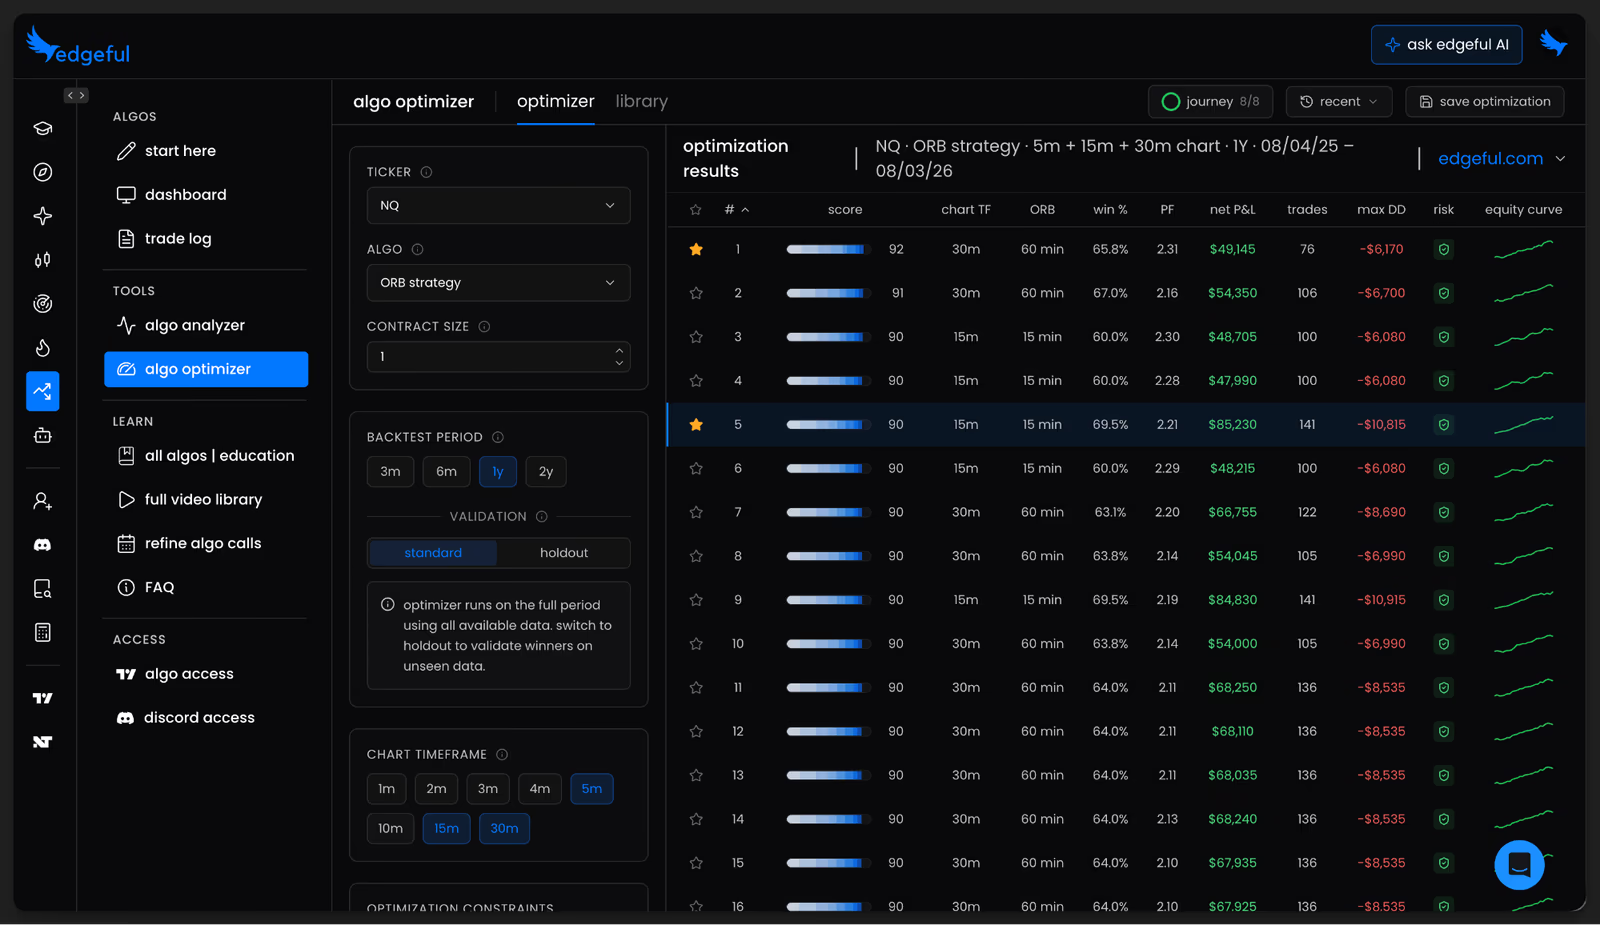
Two tools sit next to the algos:
- The optimizer tests up to 20 million parameter combinations of one algo and ranks them. It can find different settings for each weekday and merge them into one strategy. Its scoring marks down results that look too good to be real, and it checks the winners on data they weren't tuned on. That cuts the risk of an overfit result (settings tuned so tightly to past data that they fall apart on new data).
- The analyzer is a separate tool. A trader uploads a TradingView backtest export (a file of the trades a strategy would have taken on past data) and gets the breakdown: equity curve, monthly and weekday results, losing streaks, and a Monte Carlo test that reshuffles the trades 1,000+ times to show a range of outcomes. A prop firm simulator runs the same trades against account rules like a trailing drawdown, a daily loss limit, and a consistency rule, with a custom builder for any rule set.
Default settings are a starting point. Algo results depend on how a trader customizes and tests the settings for their own market and account, and that takes time and ongoing effort. The algos also come with monthly group optimization calls and an algos-only Discord.
The API and MCP connector
The edgeful API gives programmatic access to the same report data, and it's included on every paid plan with a different scope on each. A trader can pull it into their own dashboard, a spreadsheet, or a script.
The MCP connector went live on August 28, 2026. MCP (Model Context Protocol) is the open standard AI assistants use to call outside tools. With it, Claude, ChatGPT, and GrokBot can pull edgeful data mid-conversation after a one-time sign-in, and coding agents like Claude Code, Codex, and Cursor can call the API with a key. The API has no webhooks. It's a pull-based data source.
Pricing
edgeful has 3 plans. Annual plans are paid up front.
essential: $49/month or $399/year
- All 150+ reports, what's in play, and the screener
- edgeful AI and the custom report builder
- 50+ TradingView indicators
- API access with a starter set of reports and tickers, 6 months of history, no live data
pro: $99/month (in-app upgrade)
- Everything in essential
- Full API access: all reports and tickers, live data, 8 years of history
- The plan for data-focused traders who want to bring more AI into their process, through the API or the MCP connector
all access: $299/month or $2,399/year
- Everything in pro
- The 7 automated algos, the optimizer, and the analyzer
- Broker automation, monthly algo optimization calls, and the algos-only Discord
On essential and all access, the annual price comes to roughly 32% to 33% less than 12 monthly payments.
Who it is for
edgeful fits retail futures traders and prop firm traders who want a set process: which setups to trade, which days to sit out, and where to put targets and stops, all based on numbers rather than gut feel. Traders already charting in TradingView get the most out of the indicators, since the levels land on the charts they already use.
pro fits a trader who already uses AI trading tools and wants them, or their own code, to pull edgeful's numbers. all access fits a trader who wants to automate a rules-based strategy and is willing to spend time customizing and testing its settings.
It's a weaker fit for someone who wants a service that calls trades for them. edgeful doesn't send trade calls. It's also a lot to take in for someone who has never placed a trade, since the reports assume basic comfort with terms like stops, targets, and sessions.
FAQ
Is edgeful worth it?
It depends on how much of the platform a trader will use. A trader who checks a handful of reports each day and plots the levels in TradingView gets most of the value from essential at $49 a month. pro and all access make sense only for traders who plan to use the API or the algos.
Is edgeful a TradingView alternative?
edgeful works alongside TradingView. The charting stays in TradingView, and edgeful adds the historical numbers behind a setup plus 50+ indicators that draw those levels on the chart. The algos also run as TradingView strategies.
Does edgeful tell you what to trade?
No. edgeful shows how often a setup has worked and what the live numbers look like today. The trader makes the decision. The algos place trades only on settings the trader picks.
What markets does edgeful cover?
Futures are the main focus, including ES, NQ, gold, crude oil, and the micro contracts. Stocks, ETFs, forex, and crypto are covered too.
Can edgeful connect to ChatGPT or Claude?
Yes. The MCP connector lets Claude, ChatGPT, and GrokBot pull edgeful data after a one-time sign-in, and coding agents like Claude Code, Codex, and Cursor can use the API with a key. Every paid plan includes API access, and the full scope comes with pro and all access.
How much does edgeful cost?
essential is $49 a month, pro is $99, and all access is $299. essential and all access also come as annual plans, at $399 and $2,399 a year.
Some offers on this page may be paid placements or contain affiliate links.