Last updated: March 2026
Amplitude Review: Product Analytics for Teams That Want to Understand User Behavior
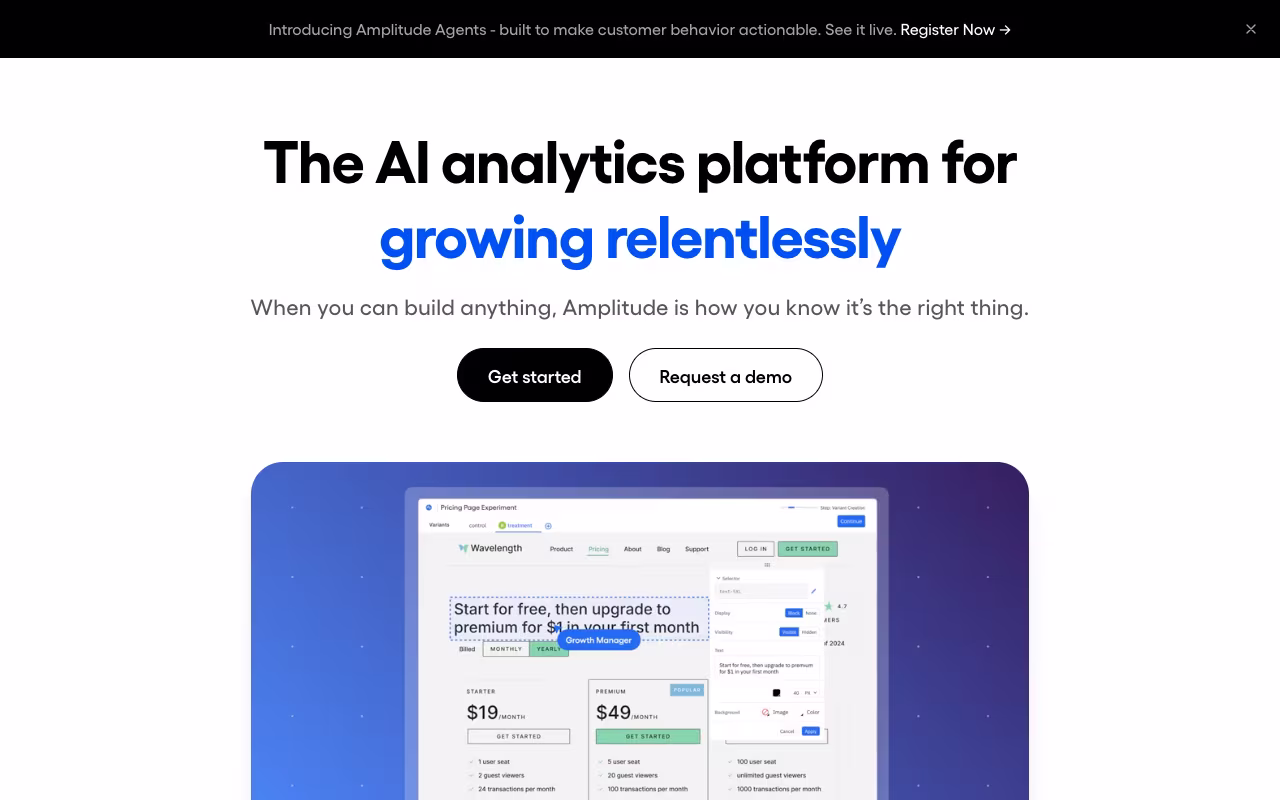
Most analytics tools tell you what happened on your website or app. How many page views, how many signups, how many people clicked that button. That is useful, but it is only half the story. The real question is why users behave the way they do, and that is where Amplitude excels.
Amplitude is a product analytics platform built for teams that need to go deeper than surface-level metrics. It tracks user behavior at the event level, letting you build funnels, analyze retention cohorts, map user journeys, and run experiments. Over 45,000 teams use it, from early-stage startups to enterprises like PayPal, Walmart, and NBC.
If your product decisions are driven by data (or should be), Amplitude is one of the most powerful tools available. But that power comes with complexity and cost that not every team needs.
Try Amplitude FreeKey Features
Event-Based Analytics
Unlike page-view-centric tools like Google Analytics, Amplitude tracks events: specific actions users take inside your product. Button clicks, feature usage, form submissions, purchases, anything you instrument. This event-based model lets you answer precise questions like "What percentage of users who completed onboarding used feature X within their first week?" or "Which user actions correlate most strongly with long-term retention?"
You define your own event taxonomy, which gives you complete flexibility but also means setup quality directly determines how useful Amplitude will be. Teams with a clear data strategy get enormous value. Teams that instrument randomly get a mess.
Funnel Analysis
Amplitude's funnel analysis shows exactly where users drop off in multi-step flows like onboarding, checkout, or feature adoption. You can segment funnels by any user property (plan type, acquisition source, geography, device) and compare conversion rates across segments. The "conversion drivers" feature automatically identifies which user behaviors correlate with higher funnel completion, surfacing insights you might miss manually.
Retention and Cohort Analysis
Retention is where Amplitude really shines. You can build retention curves for any event, segment by cohort (signup week, acquisition channel, plan tier), and identify the specific behaviors that predict whether a user will stick around or churn. The "lifecycle" analysis breaks your user base into new, current, resurrected, and dormant segments, giving you a real-time view of product health.
User Journey Mapping
The Journeys feature visualizes the actual paths users take through your product, not the paths you designed, but the paths they actually follow. This is invaluable for spotting unexpected usage patterns, finding friction points, and understanding how different user segments interact with your product differently.
Amplitude Experiment
Amplitude includes a built-in experimentation platform combining feature flags and A/B testing. You can target experiments to specific user segments, measure impact on any event or metric, and roll out winners gradually. Having experimentation integrated with your analytics means you get richer analysis than standalone A/B testing tools typically provide.
Session Replay
Added in 2024 and refined through 2025, session replay lets you watch recordings of actual user sessions. The integration with analytics is the key differentiator here. You can go from a funnel drop-off to watching the actual sessions where users abandoned, seeing exactly what confused them.
Amplitude Pricing in 2026
Amplitude's pricing is tiered based on Monthly Tracked Users (MTUs) and the features you need.
- Starter (Free): Up to 50,000 MTUs. Includes core analytics, basic session replay, unlimited feature flags, and up to 10 saved charts. Surprisingly generous for small teams and early-stage products.
- Plus: Starting at $49/month. Scales with MTUs (1,000 to 300,000). Adds advanced charts, behavioral cohorts, data destinations, and team collaboration features. Good for growing startups that have outgrown the free tier.
- Growth: Custom pricing (typically $22,000 to $250,000+/year based on scale). Adds advanced behavioral analysis, causal analysis, unlimited cohorts, and premium integrations. Requires contacting sales.
- Enterprise: Custom pricing. Adds SSO, advanced governance, dedicated support, SLAs, and data residency options. For large organizations with complex requirements.
The jump from Plus to Growth is steep and opaque. Amplitude does not publish Growth pricing, which makes budgeting difficult. Be prepared for some back-and-forth with their sales team if your needs sit between Plus and Growth.
What We Like About Amplitude
- Best-in-class behavioral analytics: Funnel analysis, retention cohorts, and journey mapping are genuinely more powerful than what you get in Google Analytics, Mixpanel, or most competitors. If understanding user behavior is your priority, Amplitude is hard to beat.
- Generous free tier: 50,000 MTUs with core analytics is enough for many startups to run Amplitude as their primary analytics tool for months or even years before needing to pay.
- Self-serve exploration: Non-technical team members can build charts, segment users, and explore data without writing SQL. The interface takes some learning, but once you know it, the speed of insight is impressive.
- Integrated experimentation: Having A/B testing and feature flags inside your analytics platform eliminates the context-switching and data reconciliation headaches of using separate tools.
- Real-time data: Events appear in Amplitude within seconds, not hours. For teams running launches or experiments, this speed matters.
What Could Be Better
- Steep learning curve: Amplitude is not a tool you install and immediately understand. Proper event taxonomy design, chart building, and cohort analysis all require training. Budget 2 to 4 weeks for your team to become proficient.
- Setup complexity: Getting meaningful data into Amplitude requires careful instrumentation. If your events are poorly defined or inconsistently tracked, the analytics output will be garbage. Teams without a dedicated data or analytics person may struggle.
- Opaque pricing at scale: The Growth and Enterprise tiers require sales conversations, and pricing varies dramatically based on your MTU volume and negotiation. Some users on review sites report significant price increases at renewal.
- Data sync delays for exports: While the real-time dashboards are fast, syncing data back to your data warehouse can lag significantly. Some users report delays of 2+ hours, occasionally exceeding 24 hours.
- Visualization limitations: Charts are capped at one year of data per view. Teams analyzing multi-year trends need workarounds. The visualization options, while functional, are less flexible than dedicated BI tools like Looker or Tableau.
Who Should Use Amplitude (and Who Should Not)
Amplitude is ideal for: Product-led growth companies, SaaS teams, mobile app developers, and any team where understanding user behavior directly drives product decisions. If you have a dedicated product or data team that will invest in proper setup, Amplitude pays for itself through better product decisions.
Amplitude is not the best fit for: Content websites that primarily need traffic analytics (use Google Analytics). Small businesses without a technical team to manage instrumentation. Teams that only need basic metrics like page views and conversion counts. Companies where the Growth tier pricing exceeds their analytics budget.
Frequently Asked Questions
How does Amplitude compare to Google Analytics?
Google Analytics is great for website traffic analysis (sessions, page views, acquisition channels). Amplitude is better for product analytics (user behavior, retention, feature adoption). Many teams use both: GA for marketing, Amplitude for product. They solve different problems.
How does Amplitude compare to Mixpanel?
Amplitude and Mixpanel are the closest competitors in product analytics. Amplitude generally has more powerful analysis capabilities (especially journey mapping and behavioral cohorts). Mixpanel has a simpler interface and more transparent pricing. For smaller teams, Mixpanel is often easier to adopt. For deeper analysis needs, Amplitude typically wins.
Do I need a data engineer to set up Amplitude?
Not necessarily, but it helps. Amplitude offers SDKs for most platforms and a no-code event tracking option. However, building a clean event taxonomy and ensuring consistent data quality benefits significantly from someone with data experience.
Can Amplitude track marketing website performance?
Amplitude can track any web property, but it is optimized for product analytics. For marketing websites, you may find Google Analytics or a simpler tool more appropriate. Amplitude becomes valuable when you need to connect marketing touchpoints to in-product behavior.
Final Verdict
Amplitude is the gold standard for product analytics, offering depth of insight that few competitors can match. The combination of event-based tracking, behavioral cohorts, journey mapping, and integrated experimentation gives product teams a complete toolkit for understanding and improving user behavior.
The tradeoffs are real: setup requires investment, the learning curve is meaningful, and pricing at scale can be substantial. But for teams that are serious about data-driven product development, Amplitude delivers insights that directly translate to better products and stronger retention.
Start with the free Starter plan, instrument your core user flows, and evaluate whether the depth of analysis justifies moving to a paid tier. For most product-focused teams, it will.
Start Using Amplitude Free