.avif)

We all dread writing lengthy reports. And if those buttoned-up, corporate types demand graphs, charts, and visual data representations, you can kiss goodbye to those weekend plans you’ve been looking forward to for the past month. But thankfully, we live in the age of AI, where every self-proclaimed "Internet guru" is cooking up something groundbreaking (or at least claims to). And this time? They actually delivered. Meet Napkin AI.
The geniuses behind Napkin AI get it. They know cranking out finance, sales, or marketing reports—with charts so polished they’d make your boss weep tears of joy—is basically the modern workplace version of gladiator combat.
In this glorious tutorial, we’ll show you how to use Napkin AI to crank out slick graphs, charts, and other visuals in seconds. Not minutes. Seconds. Your weekend? Officially saved.
By the end of this tutorial, you’ll be able to:
- Access Napkin AI
- Add a written report
- Generate visuals from the data
- Save and share your report
Let’s get right into it!
Step 1 - Access Napkin AI
Go to Napkin and sign in to an account or create one if you haven’t done so already.
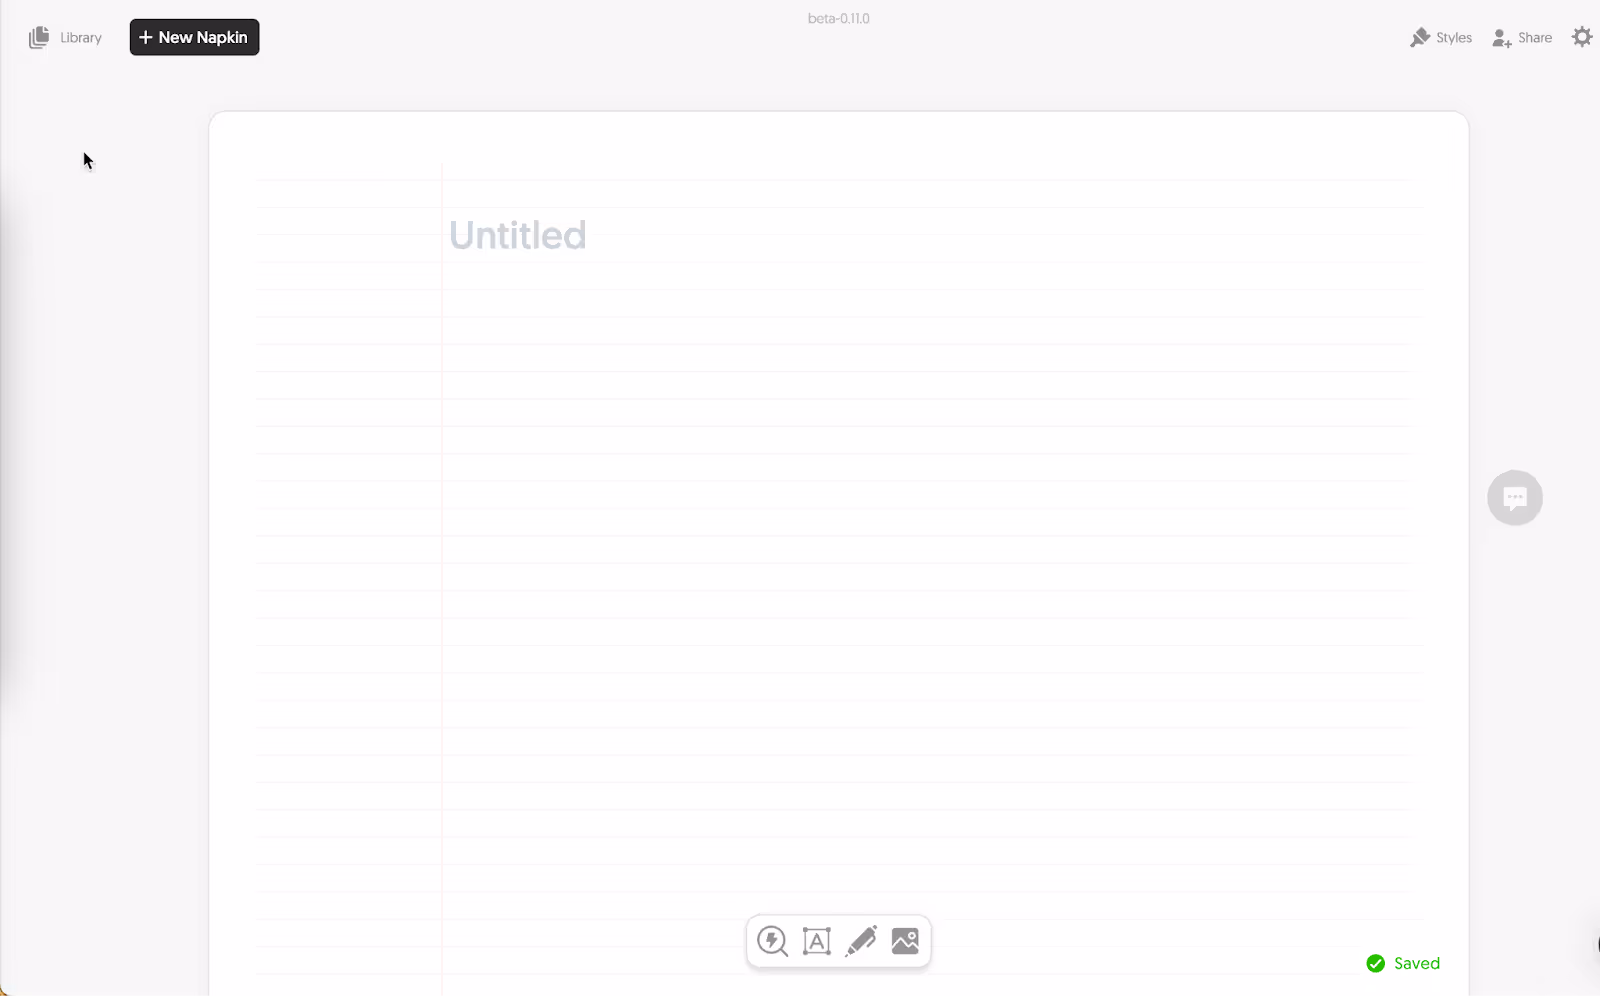
Click ‘New Napkin’ at the top right corner of the screen. Select how you want to add the report. Choose ‘Draft with AI’ if you’re on a time crunch and want to deliver the report quickly. You can import from a file or just click a blank napkin and copy/paste the text there.
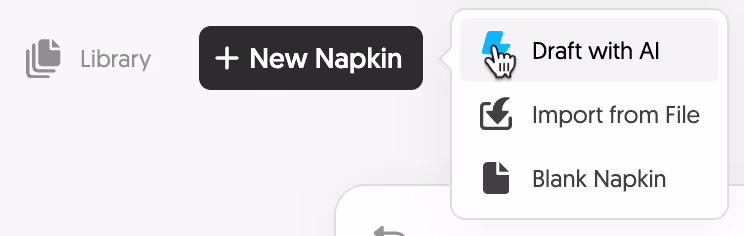
Since we want to show you how to automate the report completely, we will use a blank napkin. We chose to create a finance report, but you can make a sales, marketing, or any other type of report.
Step 2 - Add a written report
Since we selected a blank napkin, we will copy and paste our report. You can choose to import it from a file or create an entire report with the help of AI!
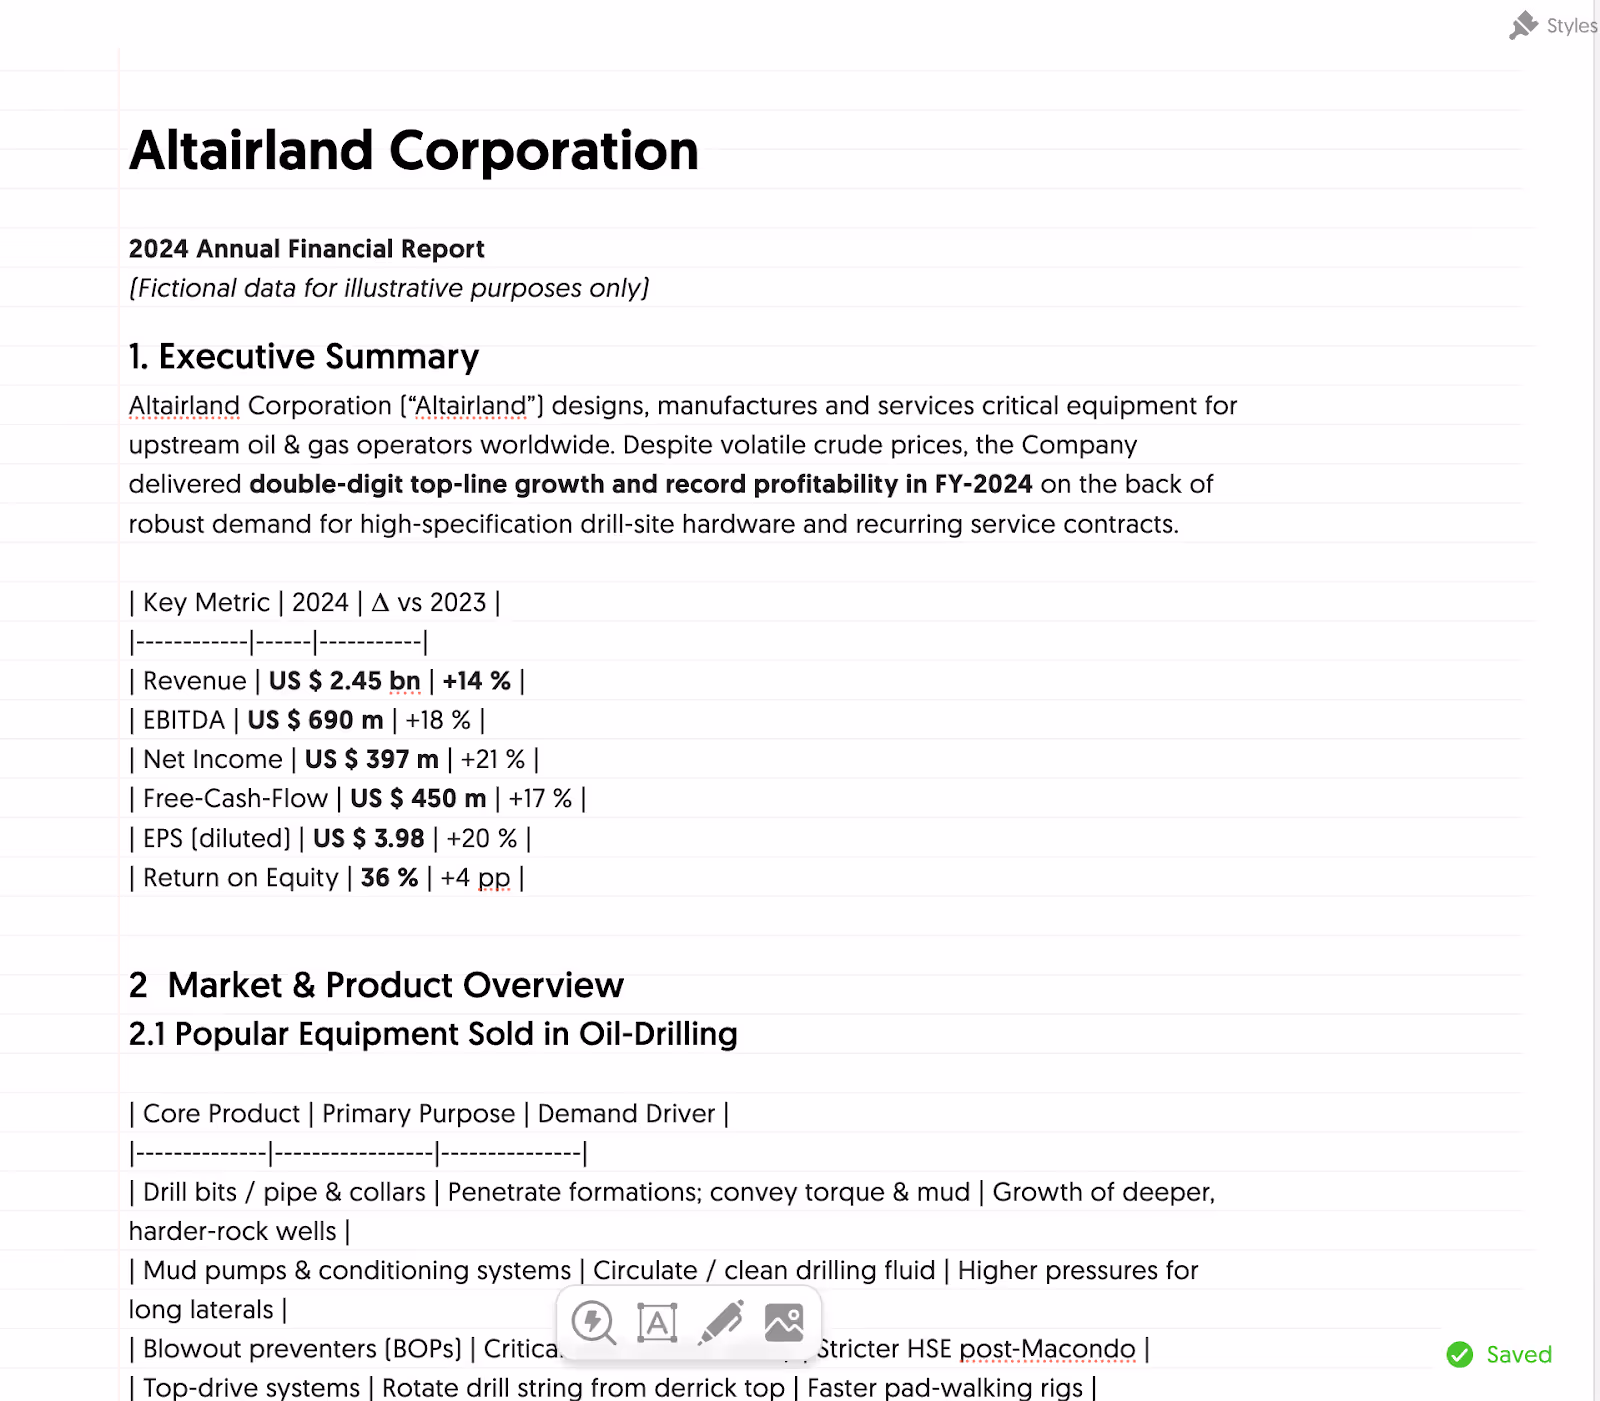
The tables are in markdown format. At the time of writing this tutorial, Napkin did not support HTML or any other table format.
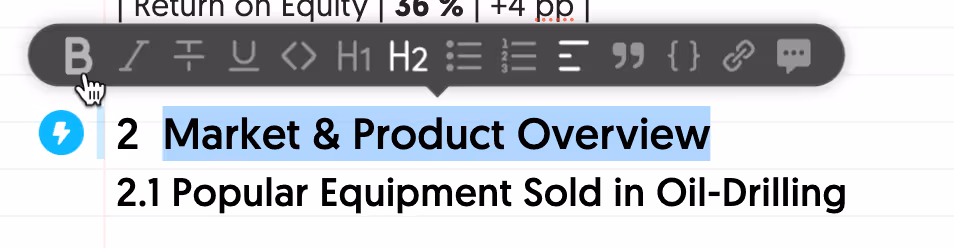
Once you’re done writing or copy/pasting the report, format the written text. Convert the headings to H1 and H2 format, bold the text, italicize, underline, or any other format that you want your report to have. Select the text you want to format, and a floating editor appears. Click the appropriate formatting option.
Step 3 - Generate visuals from the data.
Now comes the exciting part, and we mean it. The data you pasted in markdown format can now be magically converted into a chart or that visual wizardry that might take eternity to design. Click the blue button next to the data values.

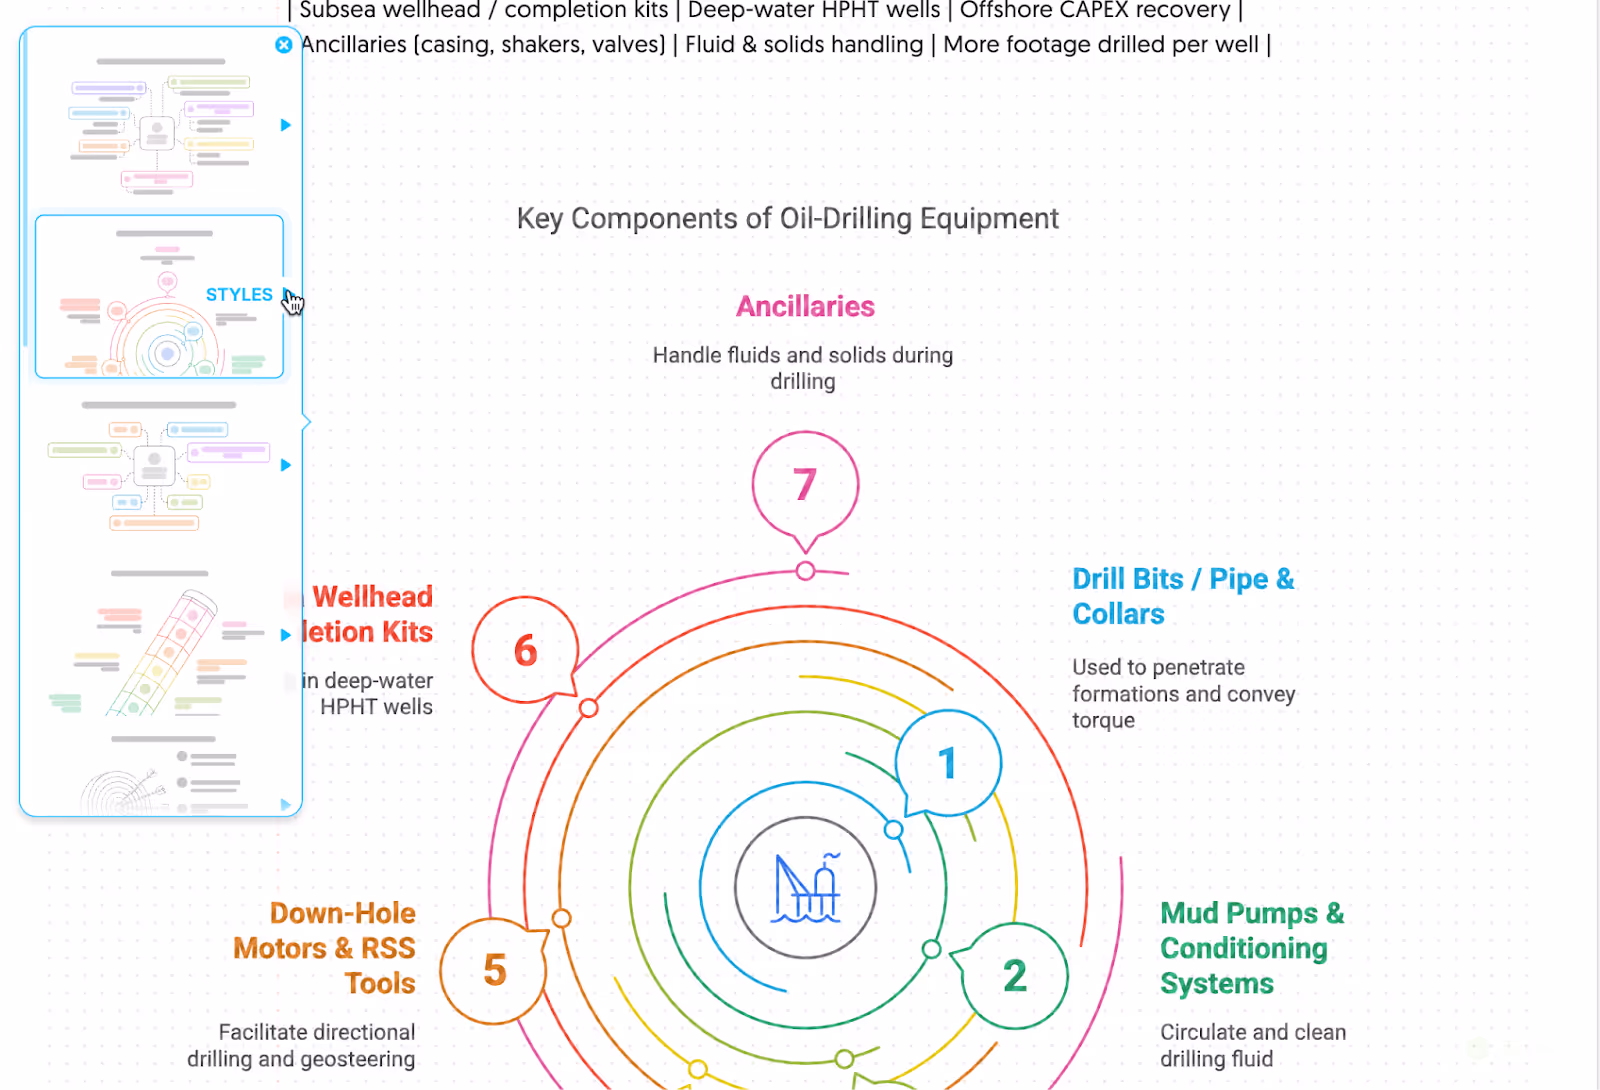
Click the visual style in which you want the data represented. Napkin offers a variety of styles.

For more styles, click the little blue arrow next to the style of your choice.
Napkin will generate a stunning data visual in seconds.
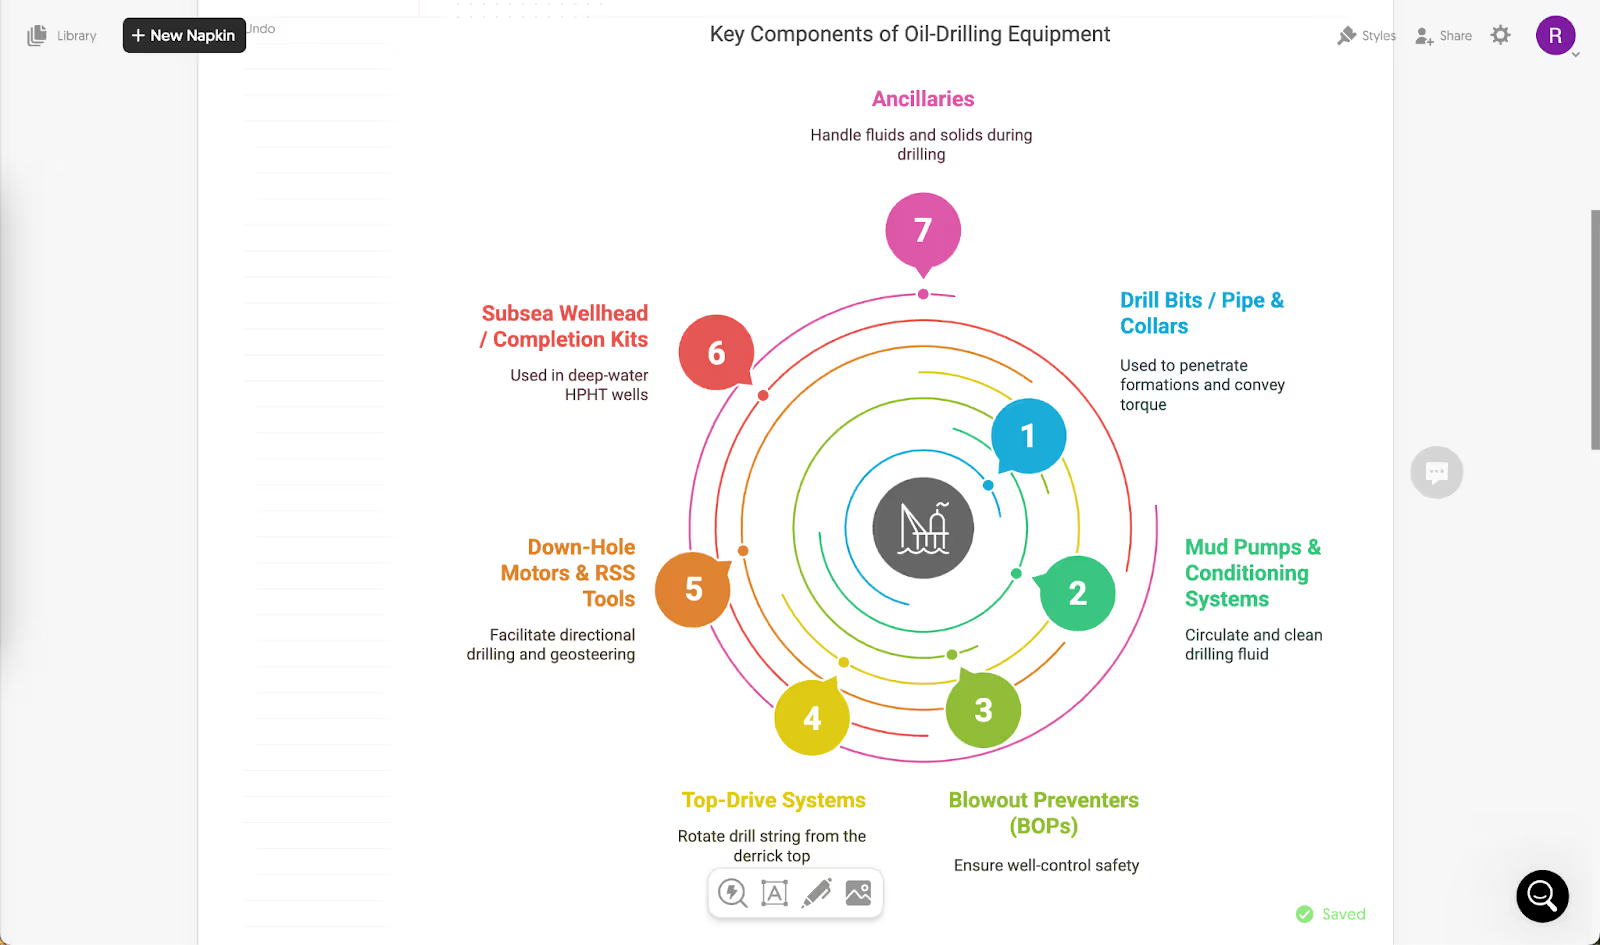
You can edit every part of this visual—changing colors, adding more data, or changing fonts and/or text size.
You can also create a fully formatted table with numbers for the data. Click the blue magic button next to the table in markdown format and choose the table layout.
You can change the color of the cells and their outline, add or delete columns and rows, and format the data.
Step 4 - Save and share your report.
Once you're satisfied with the report's visuals and text, you can share it via email. Click the ‘share’ button at the top right corner of the screen.

Specify the email address, and give appropriate permissions. Click ‘Add.’
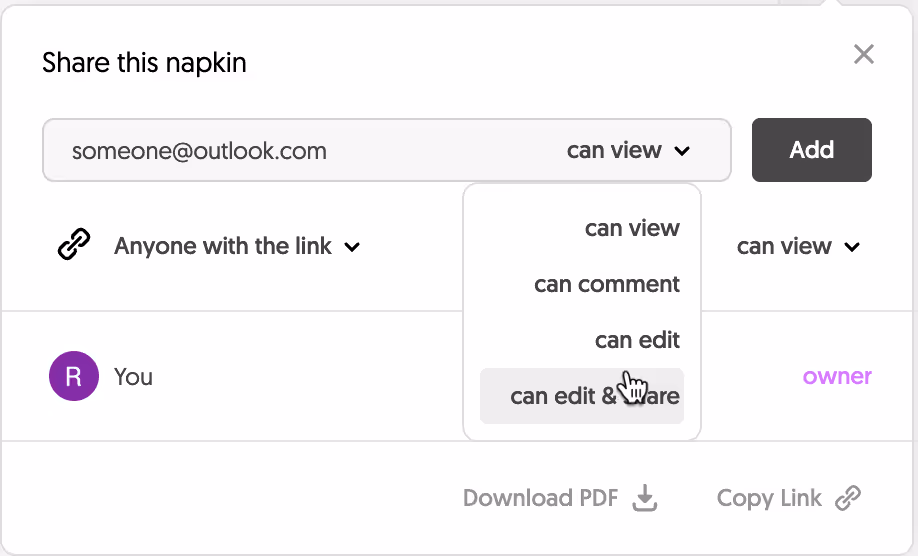
You can also download the report as a PDF or copy a link to share it with your colleagues.
Napkin did an excellent job creating fantastic visuals for the data. You can create fantastic reports in an hour while keeping those weekend plans intact. Your boss is undoubtedly in for a surprise.
.png)


