.avif)

How much time do you spend staring at the data in spreadsheets? It requires focus and some hard work to drill down into a dataset and find meaningful insights. What if AI could cut that time and allow you to see all the hidden insights in your data within minutes? It would be wonderful because you have more time to focus on other tasks.
AI is a Godsend for data analysts with gazillion worksheets. However, AI's actual value lies in augmenting rather than replacing human analysis. While AI tools like Gemini in Google Sheets can rapidly process data through simple commands like "/help analyze" for instant insights or "/help formula" for complex calculations, your expertise remains crucial for interpreting context and making strategic decisions. By automating routine spreadsheet tasks - from data cleaning to visualization - AI empowers you to focus on higher-level insights that drive business impact. Think of AI as your analytical partner in Google Sheets - it handles the heavy lifting of data processing through intuitive commands, enabling you to apply your domain knowledge where it matters most.
This tutorial is about using the Gemini sidebar to create tables, analyze data, perform conditional formatting, and create formulas to analyze data.
So, let’s start, shall we?
In this tutorial, you’ll learn how to use Gemini to:
- Create a table with Google Spreadsheet functions
- Use Conditional formatting with Gemini
- Find Duplicates
- Manage inventory
Create a table with Google Spreadsheet functions
One thing Gemini does best in Google Workspace is creating tables with populated data. It makes a table and populate it with data. It also uses Google functions to collect data. However, you should provide details in the prompt. It might not understand a simple prompt and churn out rows of data. It’s immature and naive compared to other popular tools (think ChatGPT).
Open a blank Google worksheet. Click the Gemini icon (a star of sorts) at the top right corner of the page.

In our example, we are generating a table that shows the latest market value of 5 stocks. We are specifying the number of stocks so it can calculate the total number of stocks and their market value. Here’s the prompt:
Prompt:
Create a table with a list of stocks: Apple, Abercrombie, Lucid Group, Archer Aviation and RIOT platforms. List the ticker symbol for each stock and specify the current live market value for each stock using the googlefinance function. I have 5 shares of each stock. Color the rows and the total column. Add the total amount in a separate row below the table.

Once you're satisfied with the output, click ‘Insert’ to insert the table. After the insert, the spreadsheet function will activate, listing the current market value of each stock and the total amount of our stocks.

You can instruct Gemini to add a row to this table. However, there’s a catch. It will generate the entire table with the additional row. Gemini doesn’t add individual rows. Instead, it generates the whole table and replaces the old one. Same case with deleting rows or columns. It generates a whole table with the deleted rows/columns. Use the following prompt:
Prompt:
Insert a row using the ‘Google Finance function’ and populate it with another stock with the live ticker value. The stock is Nvidia. We have 10 shares of this stock.

I guess it forgot to add the total value. That’s how Gemini is, ladies and gentlemen. Anyway, let’s continue.
Use conditional formatting
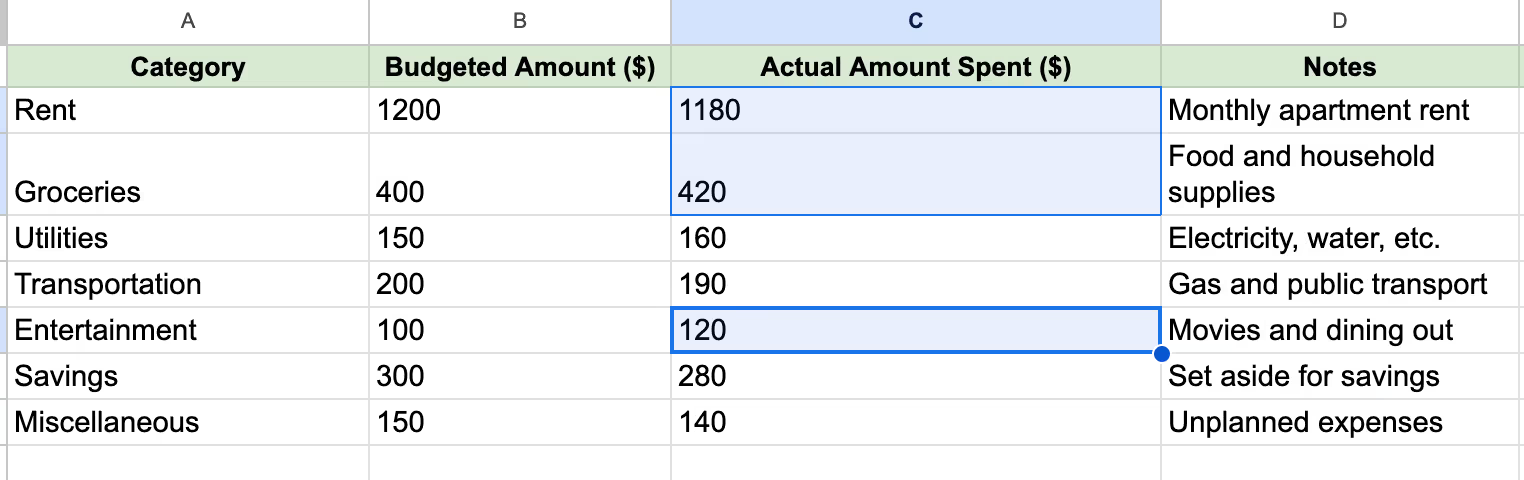
Although Gemini is very limited in its responses, you can highlight cells with certain values. Use the following prompt. Note the amount of details we provided.
Prompt:
Use conditional formatting to highlight cells that have a value greater than 200 in the actual amount spent column.
Another way to find specific information is to ask Gemini to show the biggest difference between the budgeted amount and the actual amount spent.
Prompt:
Find the difference between the highest actual amount spent and the budgeted amount.
It doesn’t format the table; rather, it provides a formula and the result.

Find duplicates
As we said earlier, Gemini is severely limited in its responses to somewhat ambiguous prompts. You need very specific wording in the prompt to urge Gemini to generate a response. It should be noted that Gemini is unable to format, edit, or change any kind of data in a cell. It cannot alter or create new rows/columns.
In order to make it work, you need to write simple prompts. It should be as simple as one, two, three. Even then, it doesn’t create a row with data. Rather, it gives you a formula you can use to fill the cells with values.
We used the following prompt to find duplicates in two columns.
Prompt:
Find duplicates in columns A and B.

So, we selected the column and used the formula it generated.

It looks pretty confusing. Well, that’s how it is. It has marked the rows with duplicate data. You can change it to any other word by editing the word “Duplicate” in the formula bar.
Manage inventory
Probably the most common use case of Google Sheets is managing inventory. You can now use Gemini to help you manage the inventory data points. The most common functions used in inventory management are SUMIF, LOOKUP, VLOOKUP, HLOOKUP, and XLOOKUP. In addition to the common formulas, you can devise one of your own that helps you with your data.
Since we have learned about the limitation of Gemini, let’s ask it to create a formula for the lowest-priced item in the south location.
Prompt:
Find the lowest priced item in the south location in sheet2

It gave us the xlookup formula to paste into a cell, as well as a result.
We are learning about its capabilities. So, let’s ask a few more questions and see if it can provide a viable result.
Prompt:
Find the locations in the table that have fresh produce.
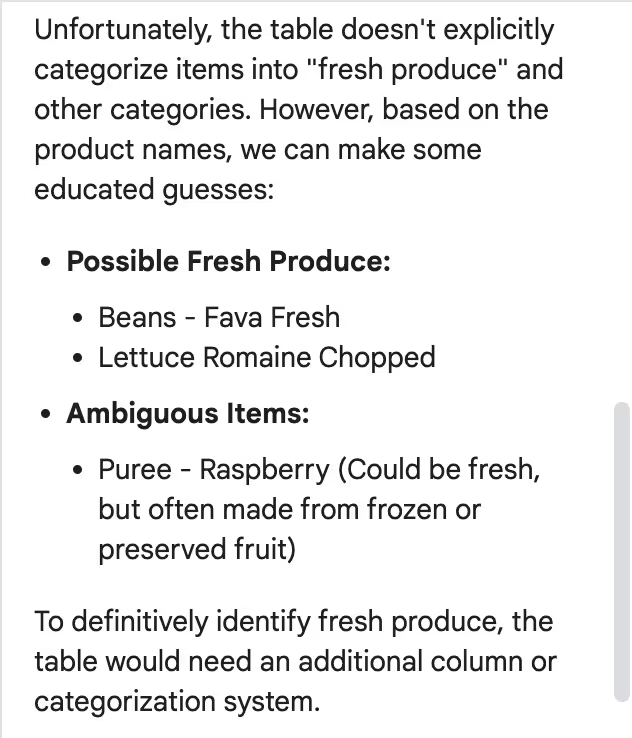
That’s not bad. At least it listed the fresh items but forgot to mention the location where they are available. Let’s ask it again.
Prompt:
List the locations that have beans and romaine lettuce.

You can ask Gemini to create formulas to find specific data. For example, you can ask it to make a formula that calculates the average price of products in the south location.
Prompt:
Create a formula that calculates the average price of products in the south location

That’s all there is to it as of now. As we said earlier, it can only understand simple queries and provide answers within the sidebar. It cannot modify rows/columns or cells. We hope that Google upgrades its Chatbot and allows us to ease our spreadsheet chores.

.png)
.png)
.png)
